Welcome to Adora 👋
We’re excited to help you kick off your journey with Adora! By the end of this guide, you’ll be able to visualise your entire product experience with journeys, dive in to user experiences with session replays and visually see product analytics come to life. Let’s dive in!Account set up
Keep an eye on your work email inbox for your Adora Magic sign-up link. Once it arrives, just click the link, set up your password, and voilà - you’re in Adora.Adora basics
At the heart of Adora are two simple building blocks: screens and journeys. They’re how Adora helps you see exactly what your users do and where they go.What is a Screen in Adora?
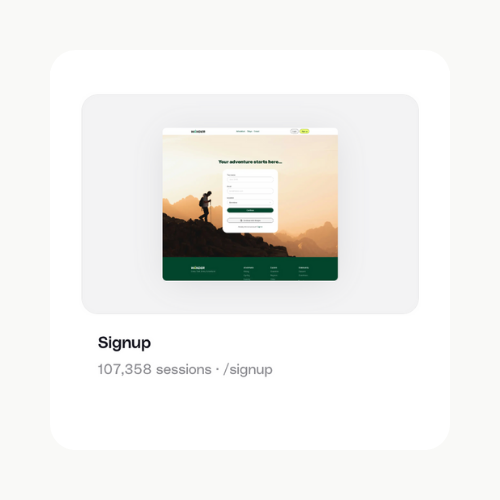
A screen is one page or view in your product, like your homepage, your pricing page, or your checkout page. When Adora tracks your product, it captures each screen your users visit. For every screen, you can see: ✅ How many sessions included this screen ✅ A screenshot of what the screen looks like ✅ Real session replays so you can watch exactly how users interacted with this screen. Think of a screen as a single step your users take inside your product.What is a Journey in Adora?
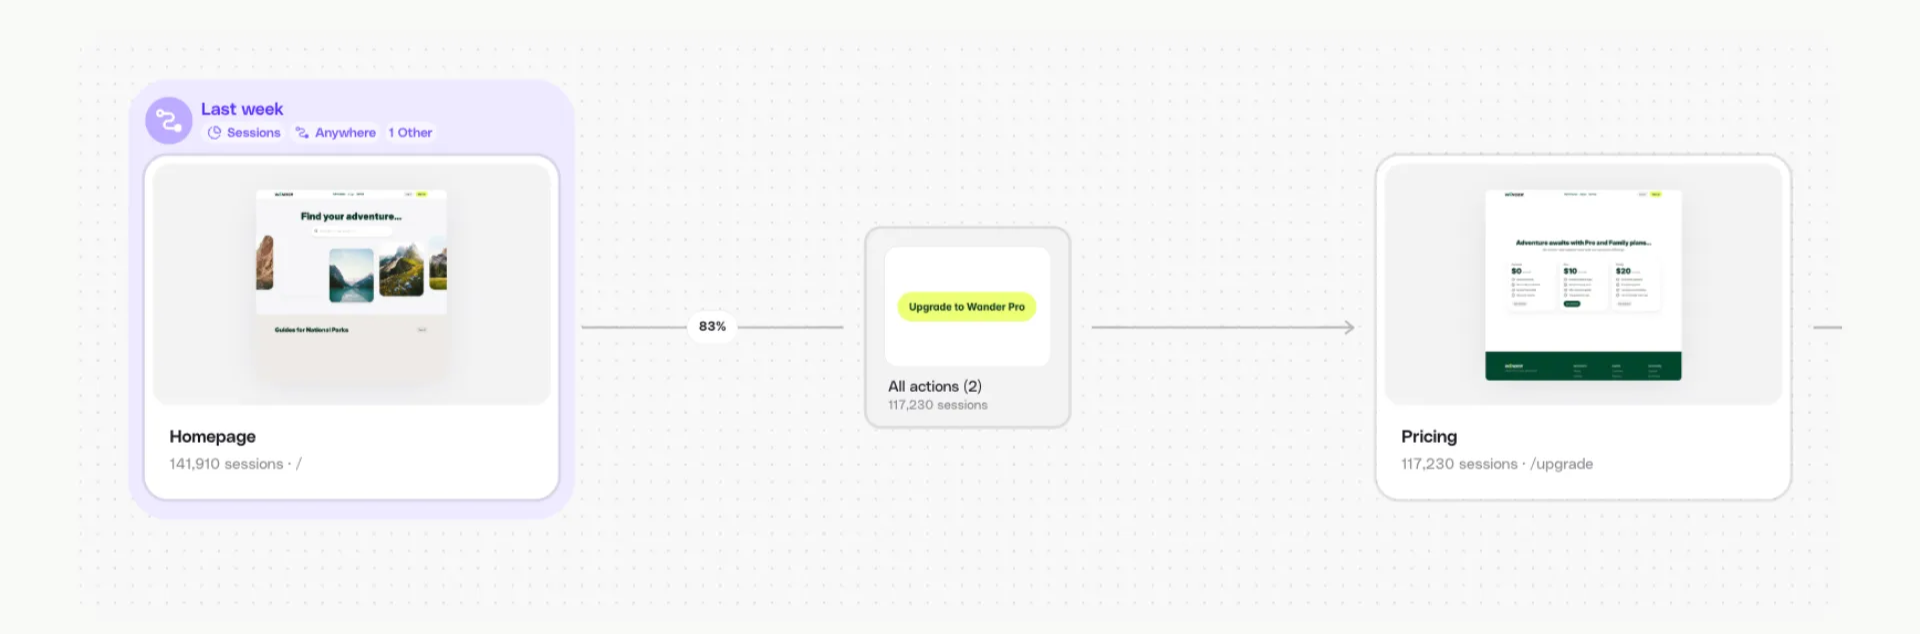
A journey is the path your users take through your product to complete a task, like signing up, adding a team member, or upgrading their plan. Journeys are made up of a series of screens, each one showing exactly where your users went and what they saw along the way. Example journey: Homepage → Pricing Page → Sign Up Page → Welcome Screen For every journey, you can see: ✅ How many sessions are attached to the journey ✅ Conversion funnel breakdown, how how many people moved from one screen to the next ✅ A screenshot of what the screen in the journey looks like ✅ Real session replays of the entire journey so you can watch exactly how users interacted with this screen.Navigating your Homepage
Understanding Screens
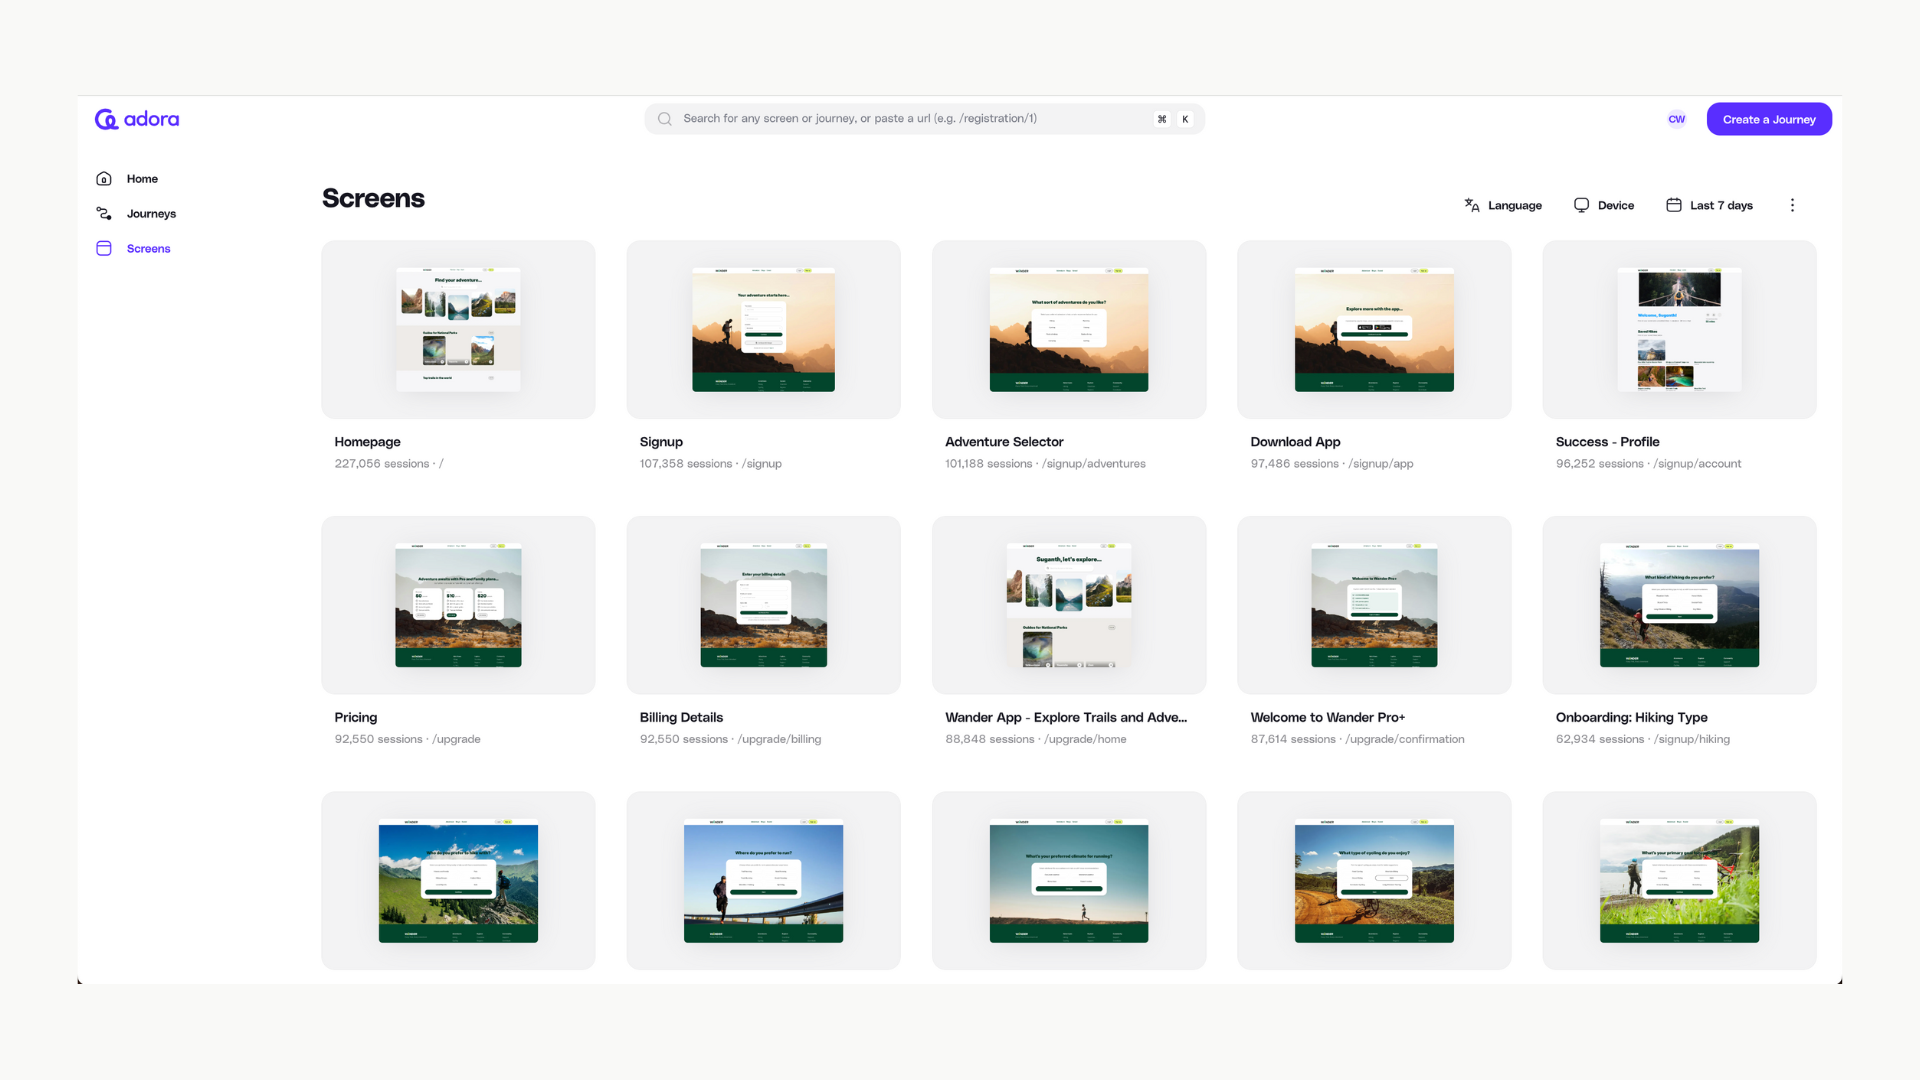
How to View Screens in Adora
- Go to “Screens.”
- Browse Your Screens.
- Select a Screen.
Understanding your Screens
Filters:
- Click on the top navigation
- Select your preferred filters
- Wait for your journey to update in accordance to your filters
Side panel navigation:
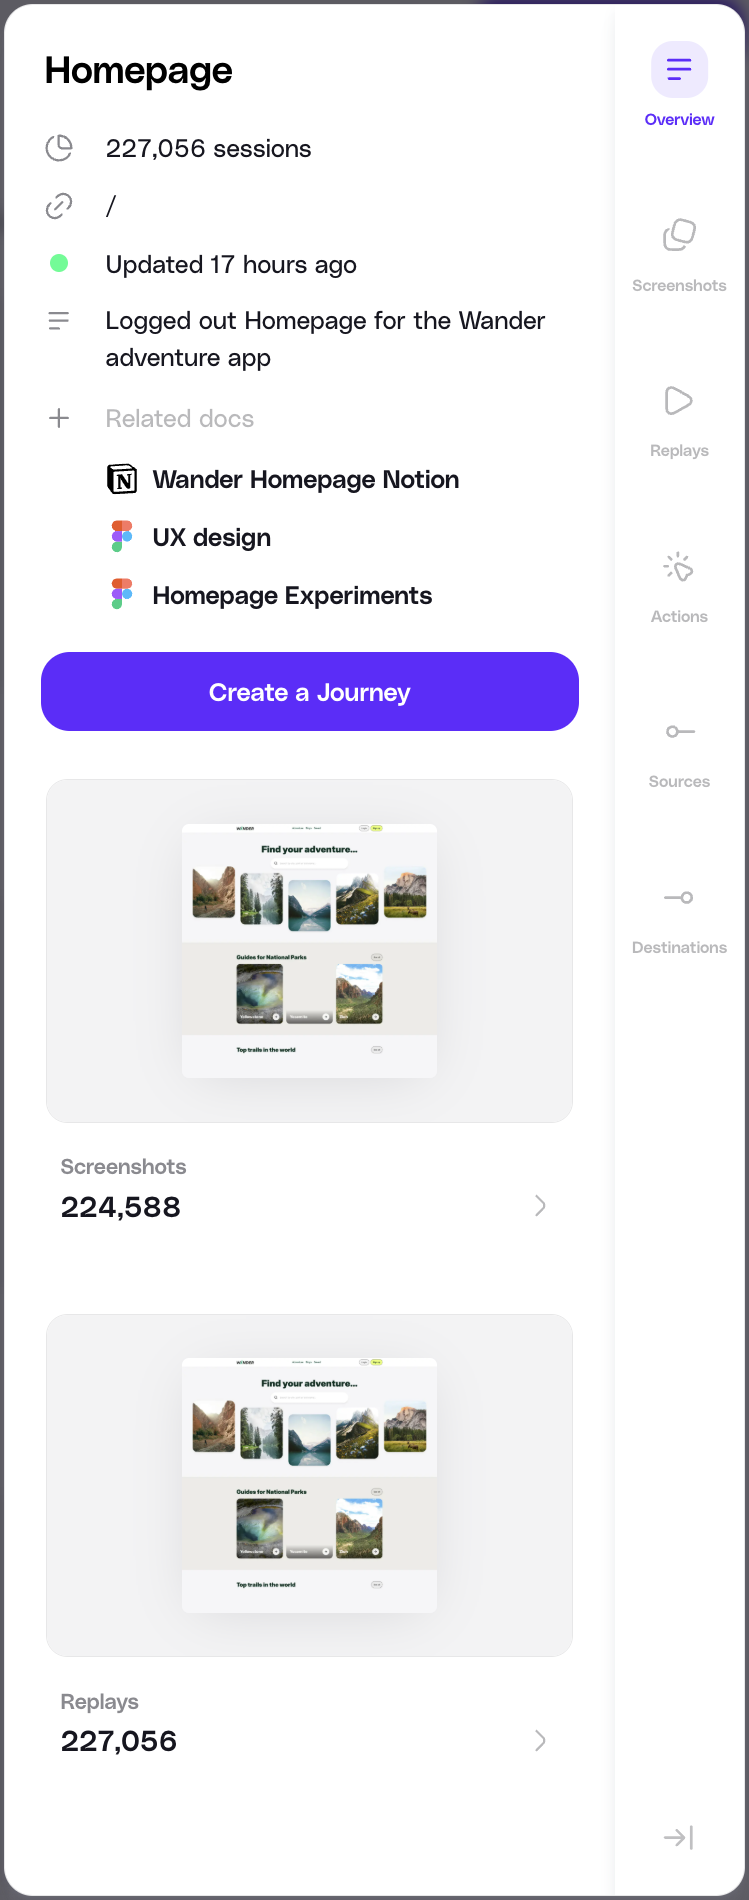
- Sessions: Total sessions that included this screen.
- URL: The live link to this screen.
- Last Updated: When the latest session was recorded.
- Description: A brief note about the screen’s role (you can edit this anytime).
- Related Links: Handy links to internal resources like Figma files, Notion docs, or pitch decks.
Mapping Journeys
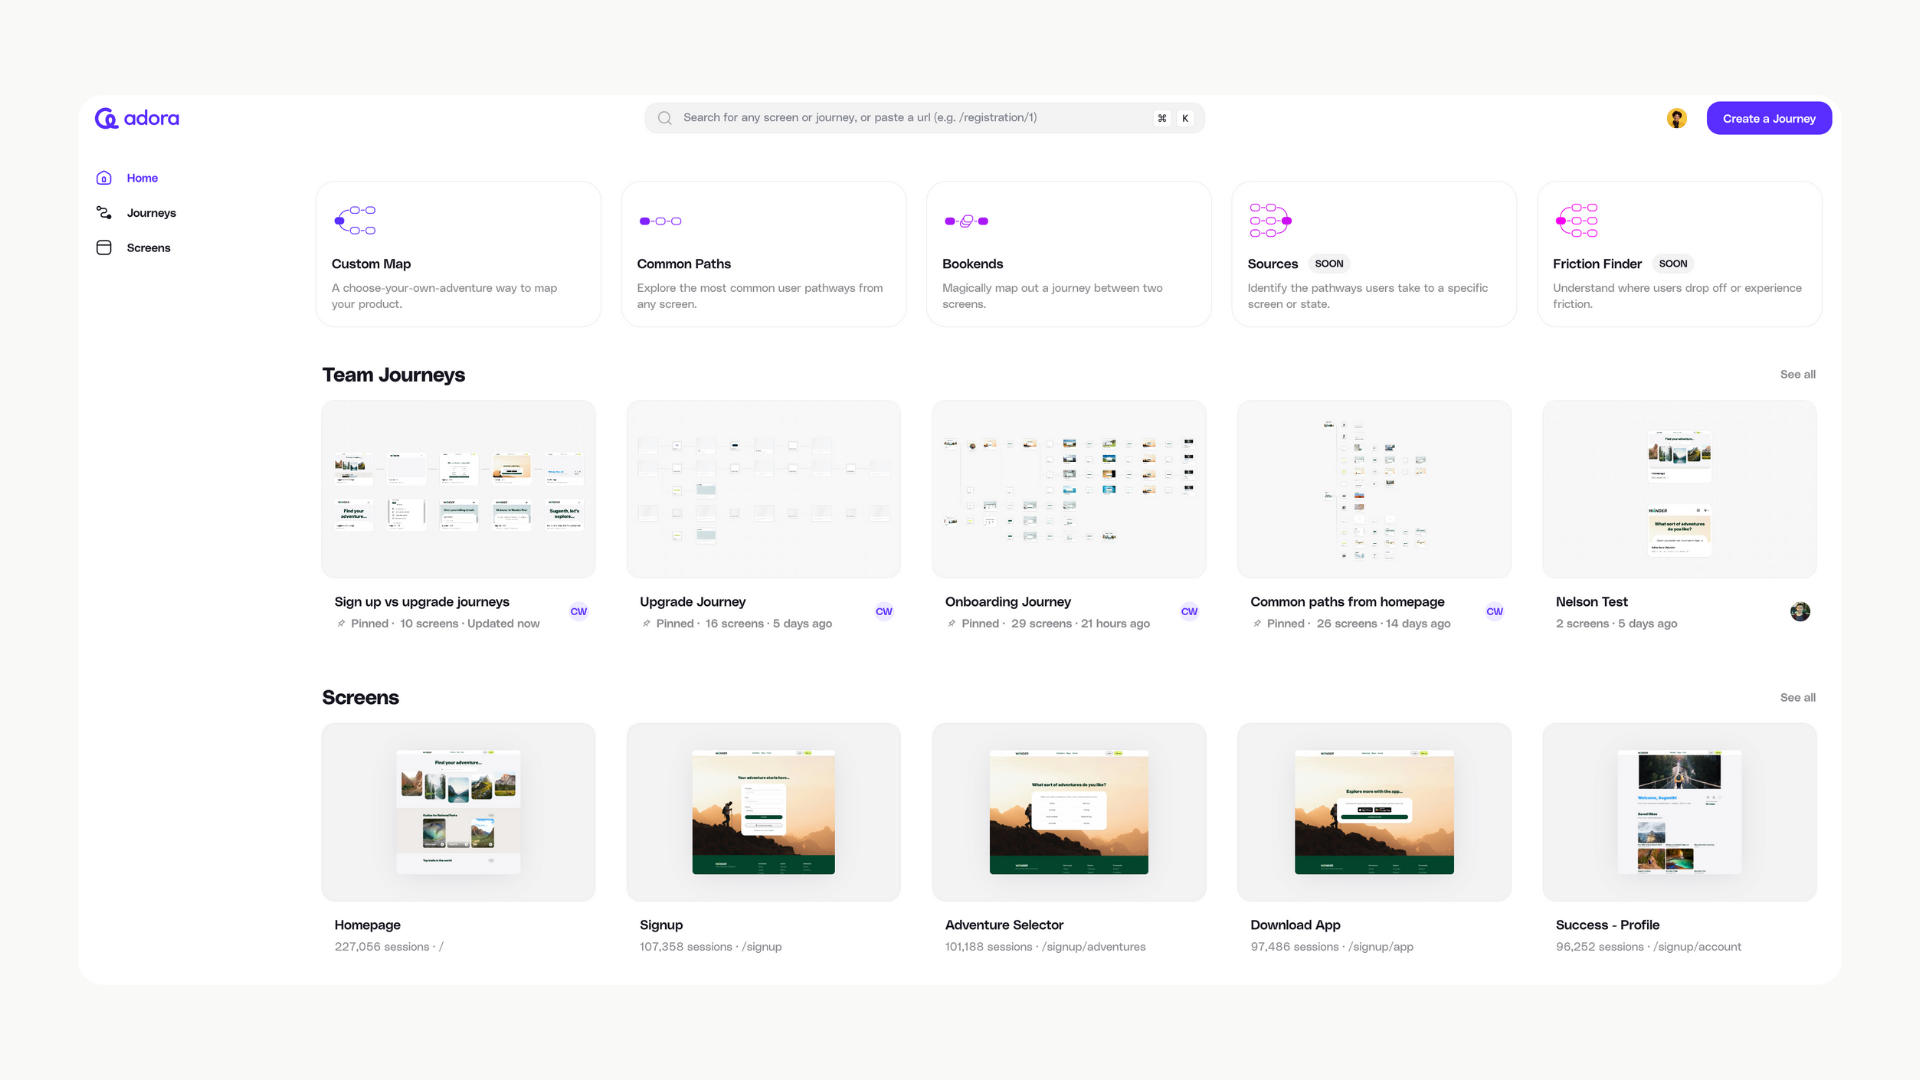
Journeys are where the magic of Adora comes to life there are few different ways to explore your products journeys.Different types of journeys
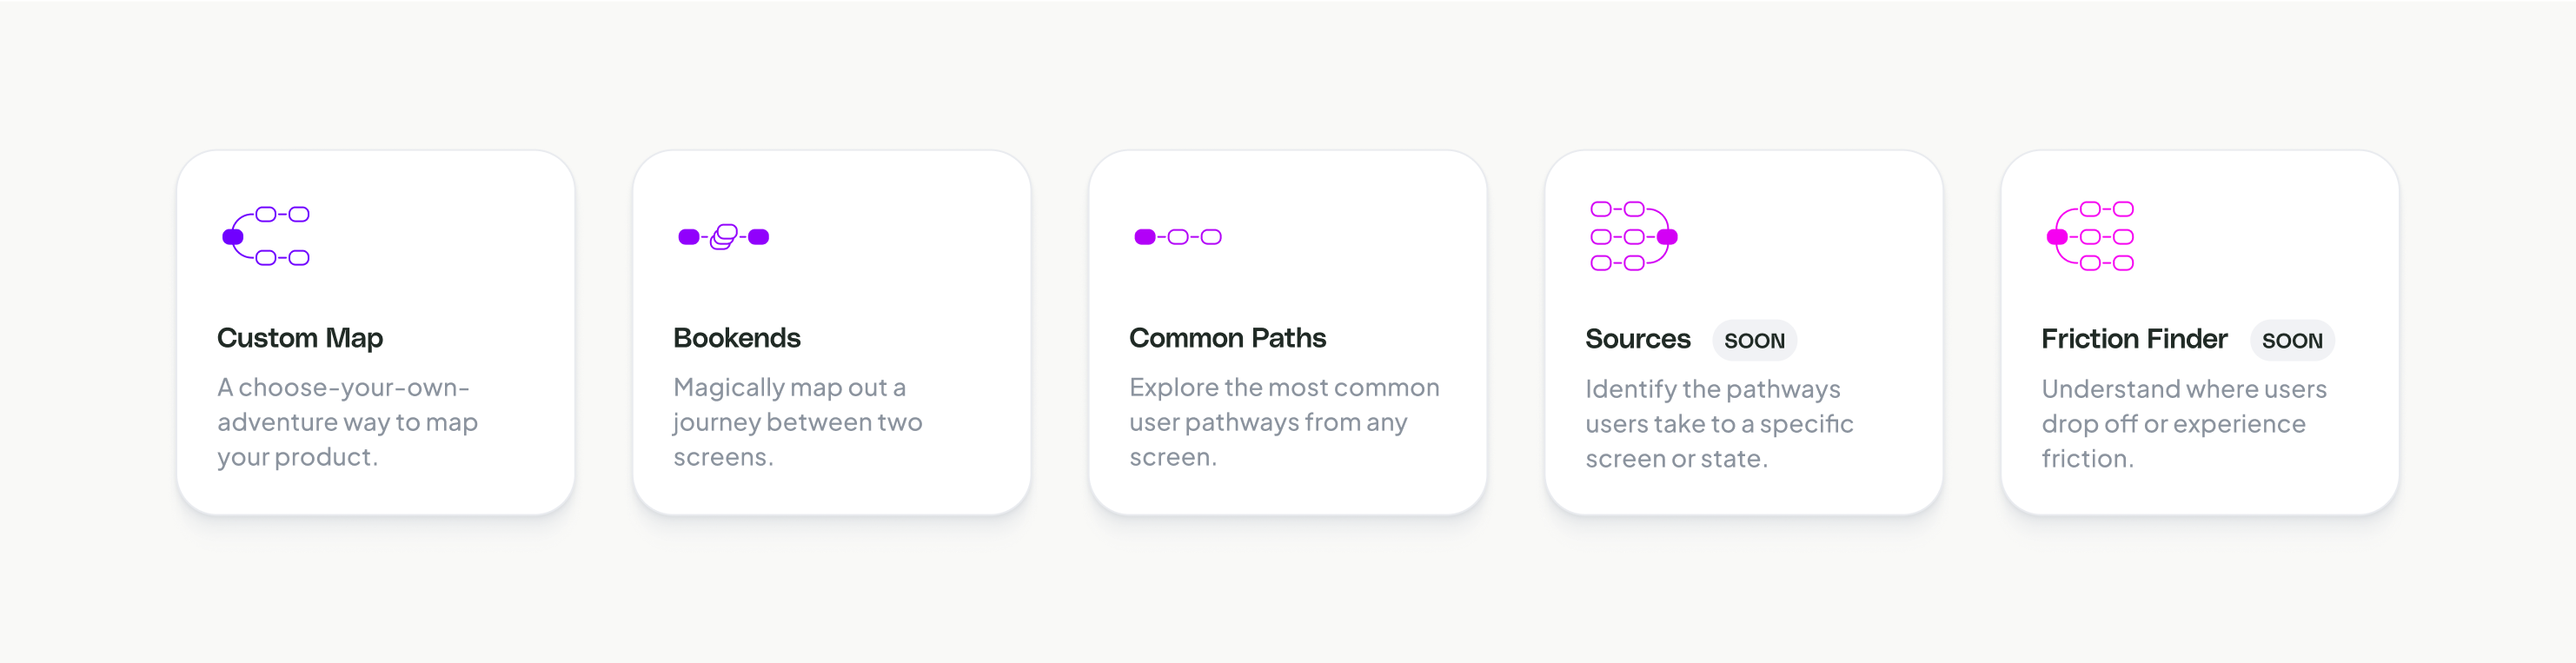
- Custom Map: Create your own journey based on your own product insights and what you want to explore.
- Bookends: See exactly where a customer’s journey starts and stops, just like a good set of bookends.
- Common Paths: Find the most common journeys your users take through the product.
- Sources: Track how users enter a journey or land on a specific screen.
- Friction Finder: Pinpoint where users drop off in a journey or leave a screen.
Viewing existing journeys
- Click on Journeys in the left-hand navigation,
- Select the journey you want to dive into.
- See your product come to life by viewing sessions and product insights attached to the journey.
Creating a new Journey
Launching a new feature or need to map an existing journey that isn’t in Adora yet? No problem! Here’s how to create a journey from scratch:- From your Home screen, click Create a Journey in the top right corner.
- A new, blank Journey map will open.
- In the right panel, Adora will suggest starting screens, ordered by popularity.
- Click on the screen you want to start with, this becomes the first step in your journey.
- Adora will automatically show you the next most common screens users visit, along with their conversion rates.
- You can also search for any screen or buttons — even if it’s a few steps ahead — giving you flexibility to map journeys at different levels of detail.
- To keep building, continue adding Screens to your Journey until complete.
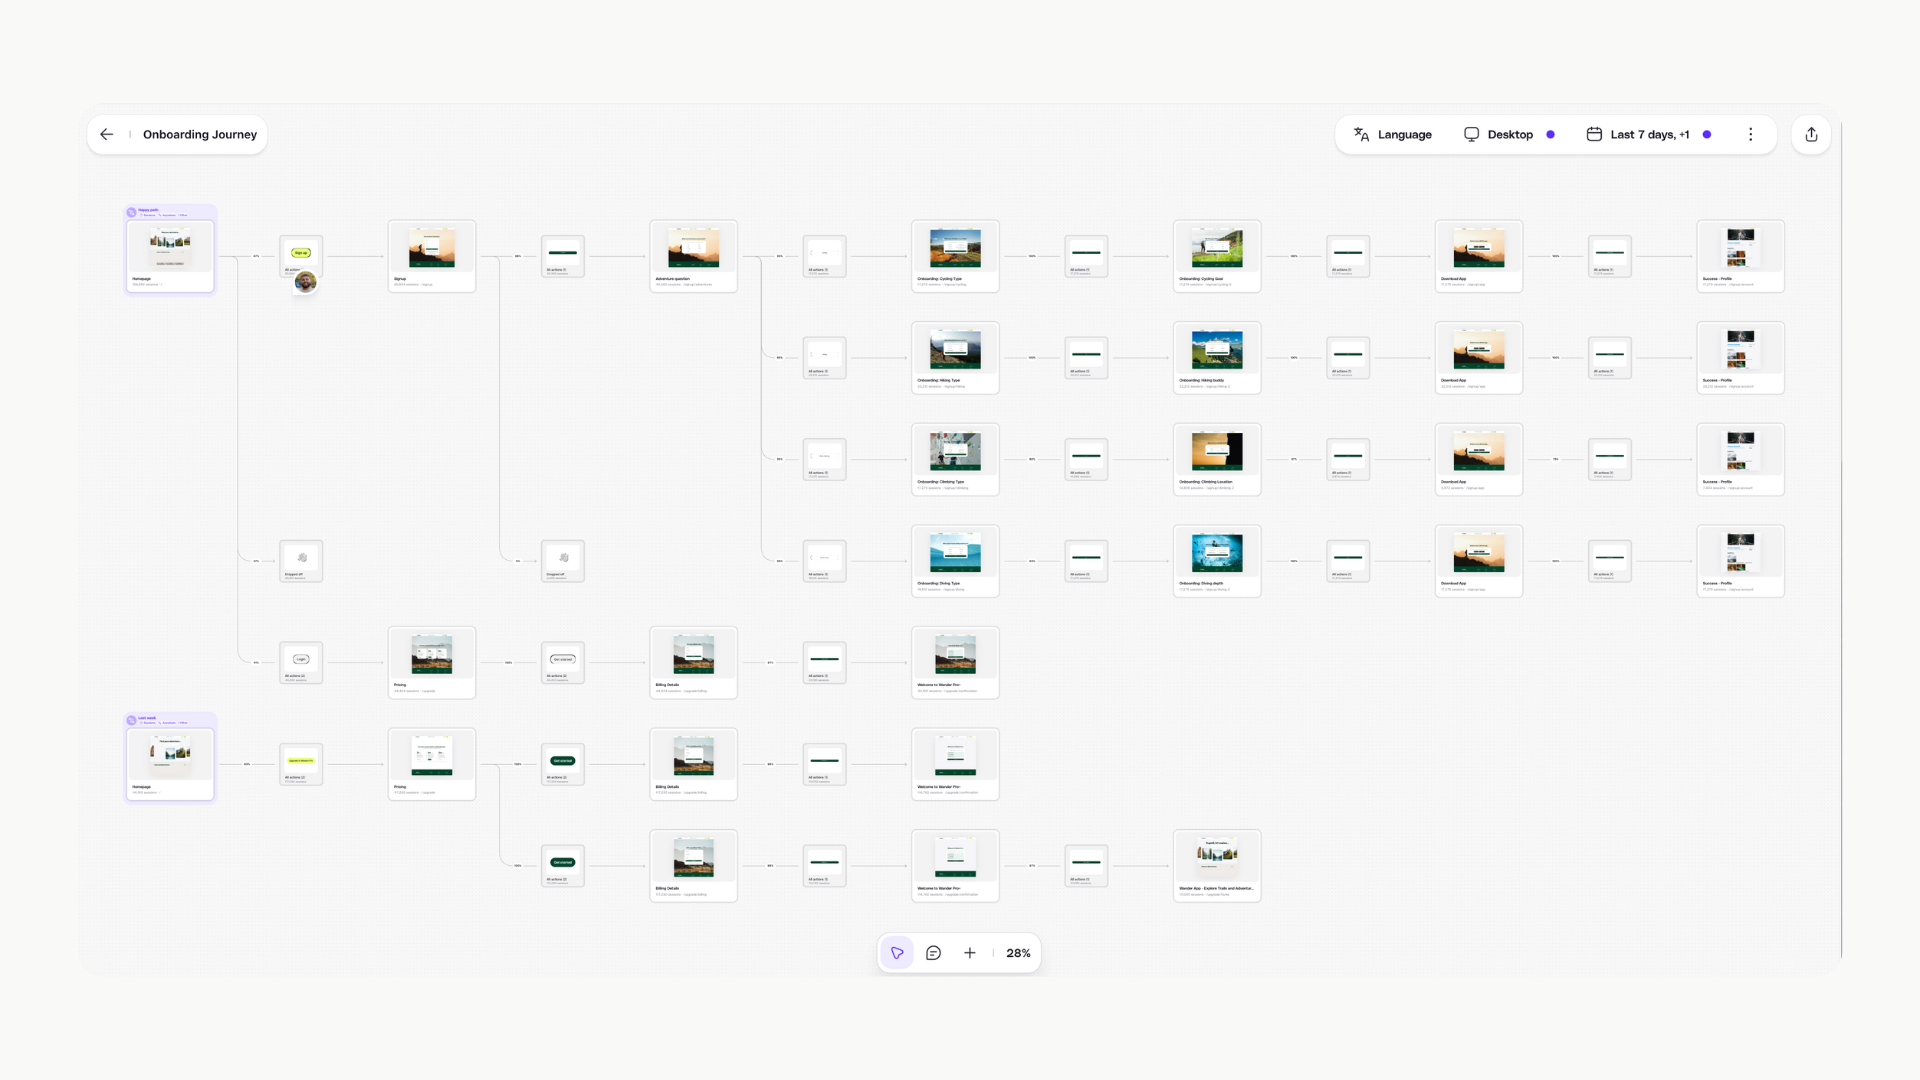
Understanding Your Journey’s
Conversion Rates
The percentage between each screen in the journey shows how many users move from one screen to the next. This helps you quickly spot where users might be dropping off or find opportunities to improve the flow and create a smoother experience.Actions
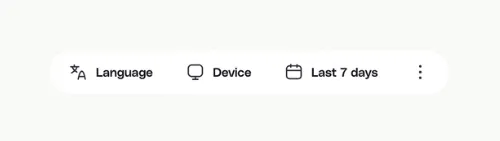
Filters
No two user experiences are the same, and filters help you see and understand the differences. Filter journeys by language, device, date, country, browser, or any custom properties you have set up, such as experiments using the top-right navigation. Want to zero in on a specific user? Filter by User ID to drill down into individual journeys.- Click on the top navigation
- Select your preferred filters
- Wait for your screen to update in accordance with your filters
Wayback Machine
Need to see how your journeys looked in the past? Use the Wayback Machine to go back days, weeks, or months. Learn from historical journeys, UX, or pinpoint bugs by revisiting older versions.- Click on the top navigation
- Select your preferred timeframe; 7 days ago, 1 month ago , 3 months ago or a custom range
- Wait for your journey to update in accordance to your filters
Deleting a Journey
To delete a journey, head to the Journeys homepage, click the three dots in the top-right corner, and select Delete. Once deleted, the journey is gone forever, so double-check before you hit delete.FAQs
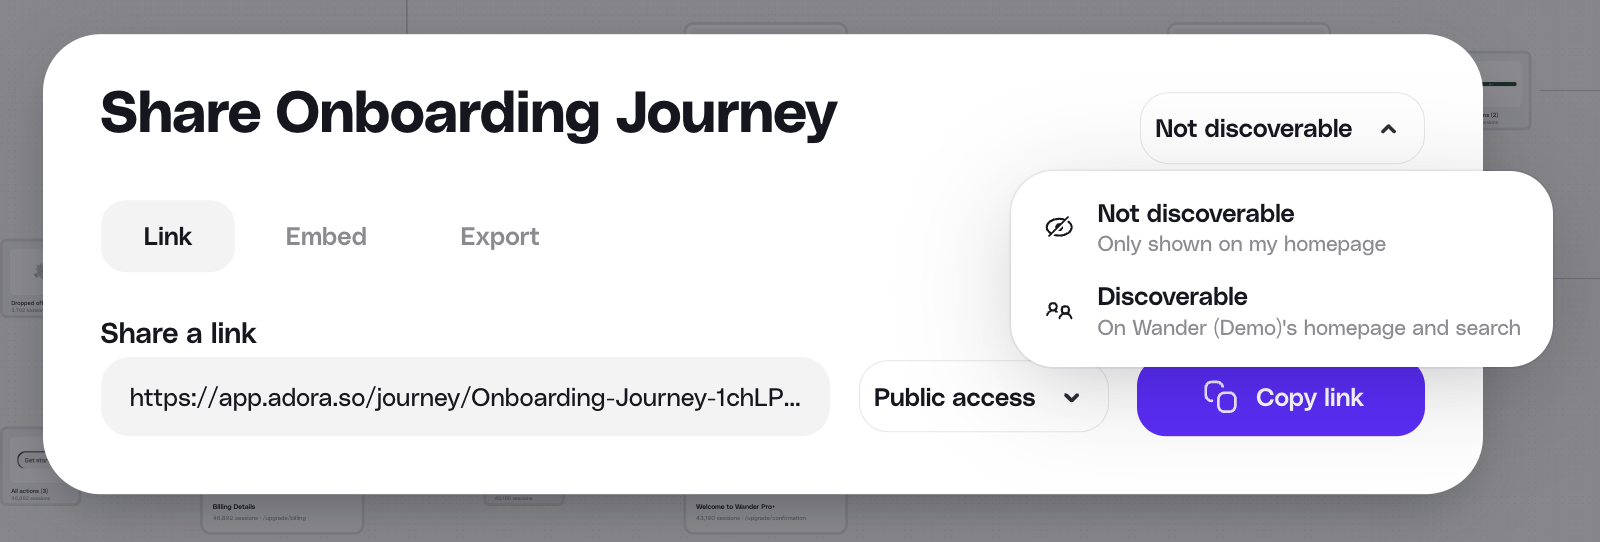
How are conversion rates in my journey calculated? By default, Adora measures the relative conversion rate between consecutive steps in a journey, rather than the absolute conversion rate from the starting point. This means each conversion rate shows: “Of the users who reached Step X, what percentage made it to Step Y?” rather than “Of all users who started the journey, what percentage made it to Step Y?” As a result, conversion rates can increase later in the journey. This typically happens when users who drop off early are less engaged, leaving a more committed audience as the journey progresses. Each step’s conversion rate is calculated from a smaller, more filtered pool of users. Example: If 1,000 users start your journey, 400 reach Step 2 (40% conversion), and 300 of those 400 reach Step 3, the Step 2→3 conversion rate would show as 75%—higher than the initial 40%. Why do my conversion rates add up to more than 100%? Users can take multiple paths in the same session. If a user goes from A → B, then later returns to A and goes to A → C, they’re counted in both conversion rates. This means the same user can contribute to multiple paths, causing the total to exceed 100%. Additionally, if you’re using “Anywhere” journeys (which track whether users eventually reach a screen, regardless of steps in between), users have more opportunities to loop back and trigger multiple paths. Does everyone on my team see the same journey? No! By default the journeys are not discoverable. To make them discoverable:- Click the share arrow in the top right
- Select the dropdown and select Discoverable
How to Share and Export Screens & Journeys
Ready to show off your amazing discoveries to the team? No problem, you’ve got a few simple ways to do it.-
Sharing: Share any Screen or Journey via the share arrow in the top right corner
- Public: Share a link that anyone can publicly access
- Team Access: Share a link that any teammate in Adora can access
-
Journey Discoverability:By default the journeys are not discoverable. To make them discoverable:
- Click the share arrow in the top right
- Select the dropdown and select Discoverable
- Embed: Drop your live journeys or screens directly into tools like Notion or Confluence for seamless knowledge sharing.
- Comment: Comment on specific parts of a journey so team they can jump in, review, make updates, and learn alongside you.