How to create different types of journeys
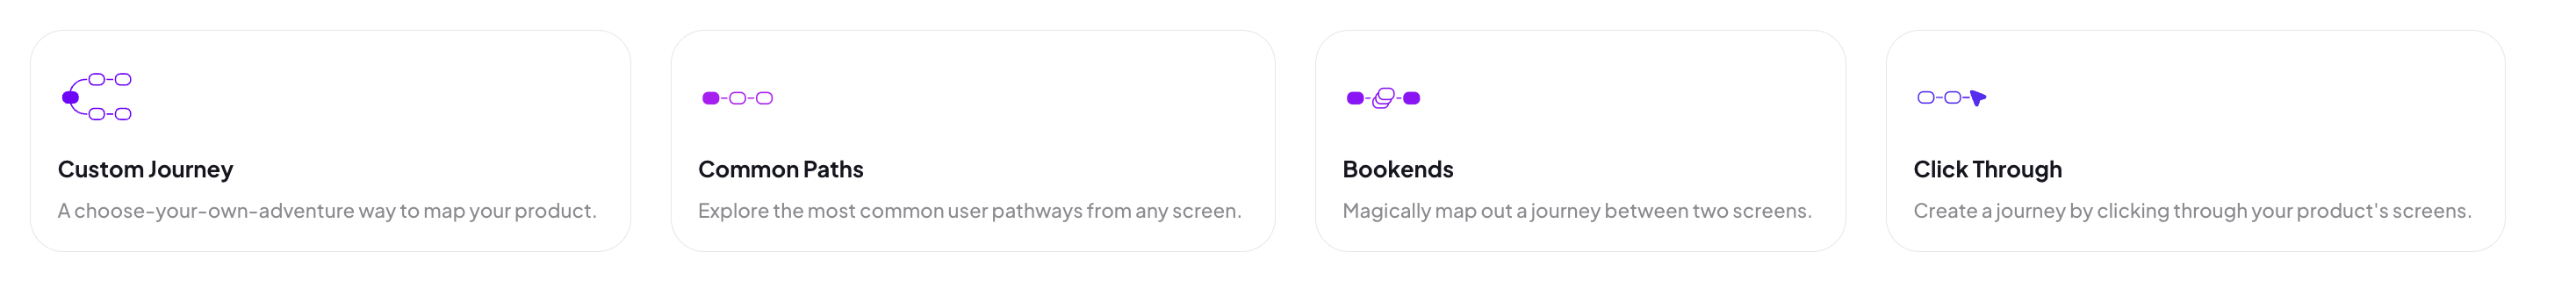
Custom Journey
Build a journey from scratch based on your insights and what you want to explore.- Click Custom Journey.
- Select a starting screen.
- Add additional screens until your journey is complete.
Common Paths
Automatically discover the most common user journeys in your product.- Click Common Paths.
- Select a screen to start from.
- Adora will map out the most frequent paths based on real user data.
Bookends
See where a user journey begins and ends, like a well-placed set of bookends.- Click Bookends.
- Select a starting screen and an ending screen.
- Adora will reveal all the screens users visit in between.
Click Through
Build a custom journey through a clickable prototype of your product.- Click Click Through.
- Select a starting screen.
- Click on an area of the screen to see the actions available to select. These should be pulsing green.
- Select an action to add it to your journey. Adora will then take you to the next screen. You can click Shuffle Journey to select different variations of the screen (e.g. mobile).
- Continue to add all your selected actions and when you’re done click Create Journey.
Changing the Journey count
Once you’ve created a journey, you can adjust how it’s viewed by changing the count.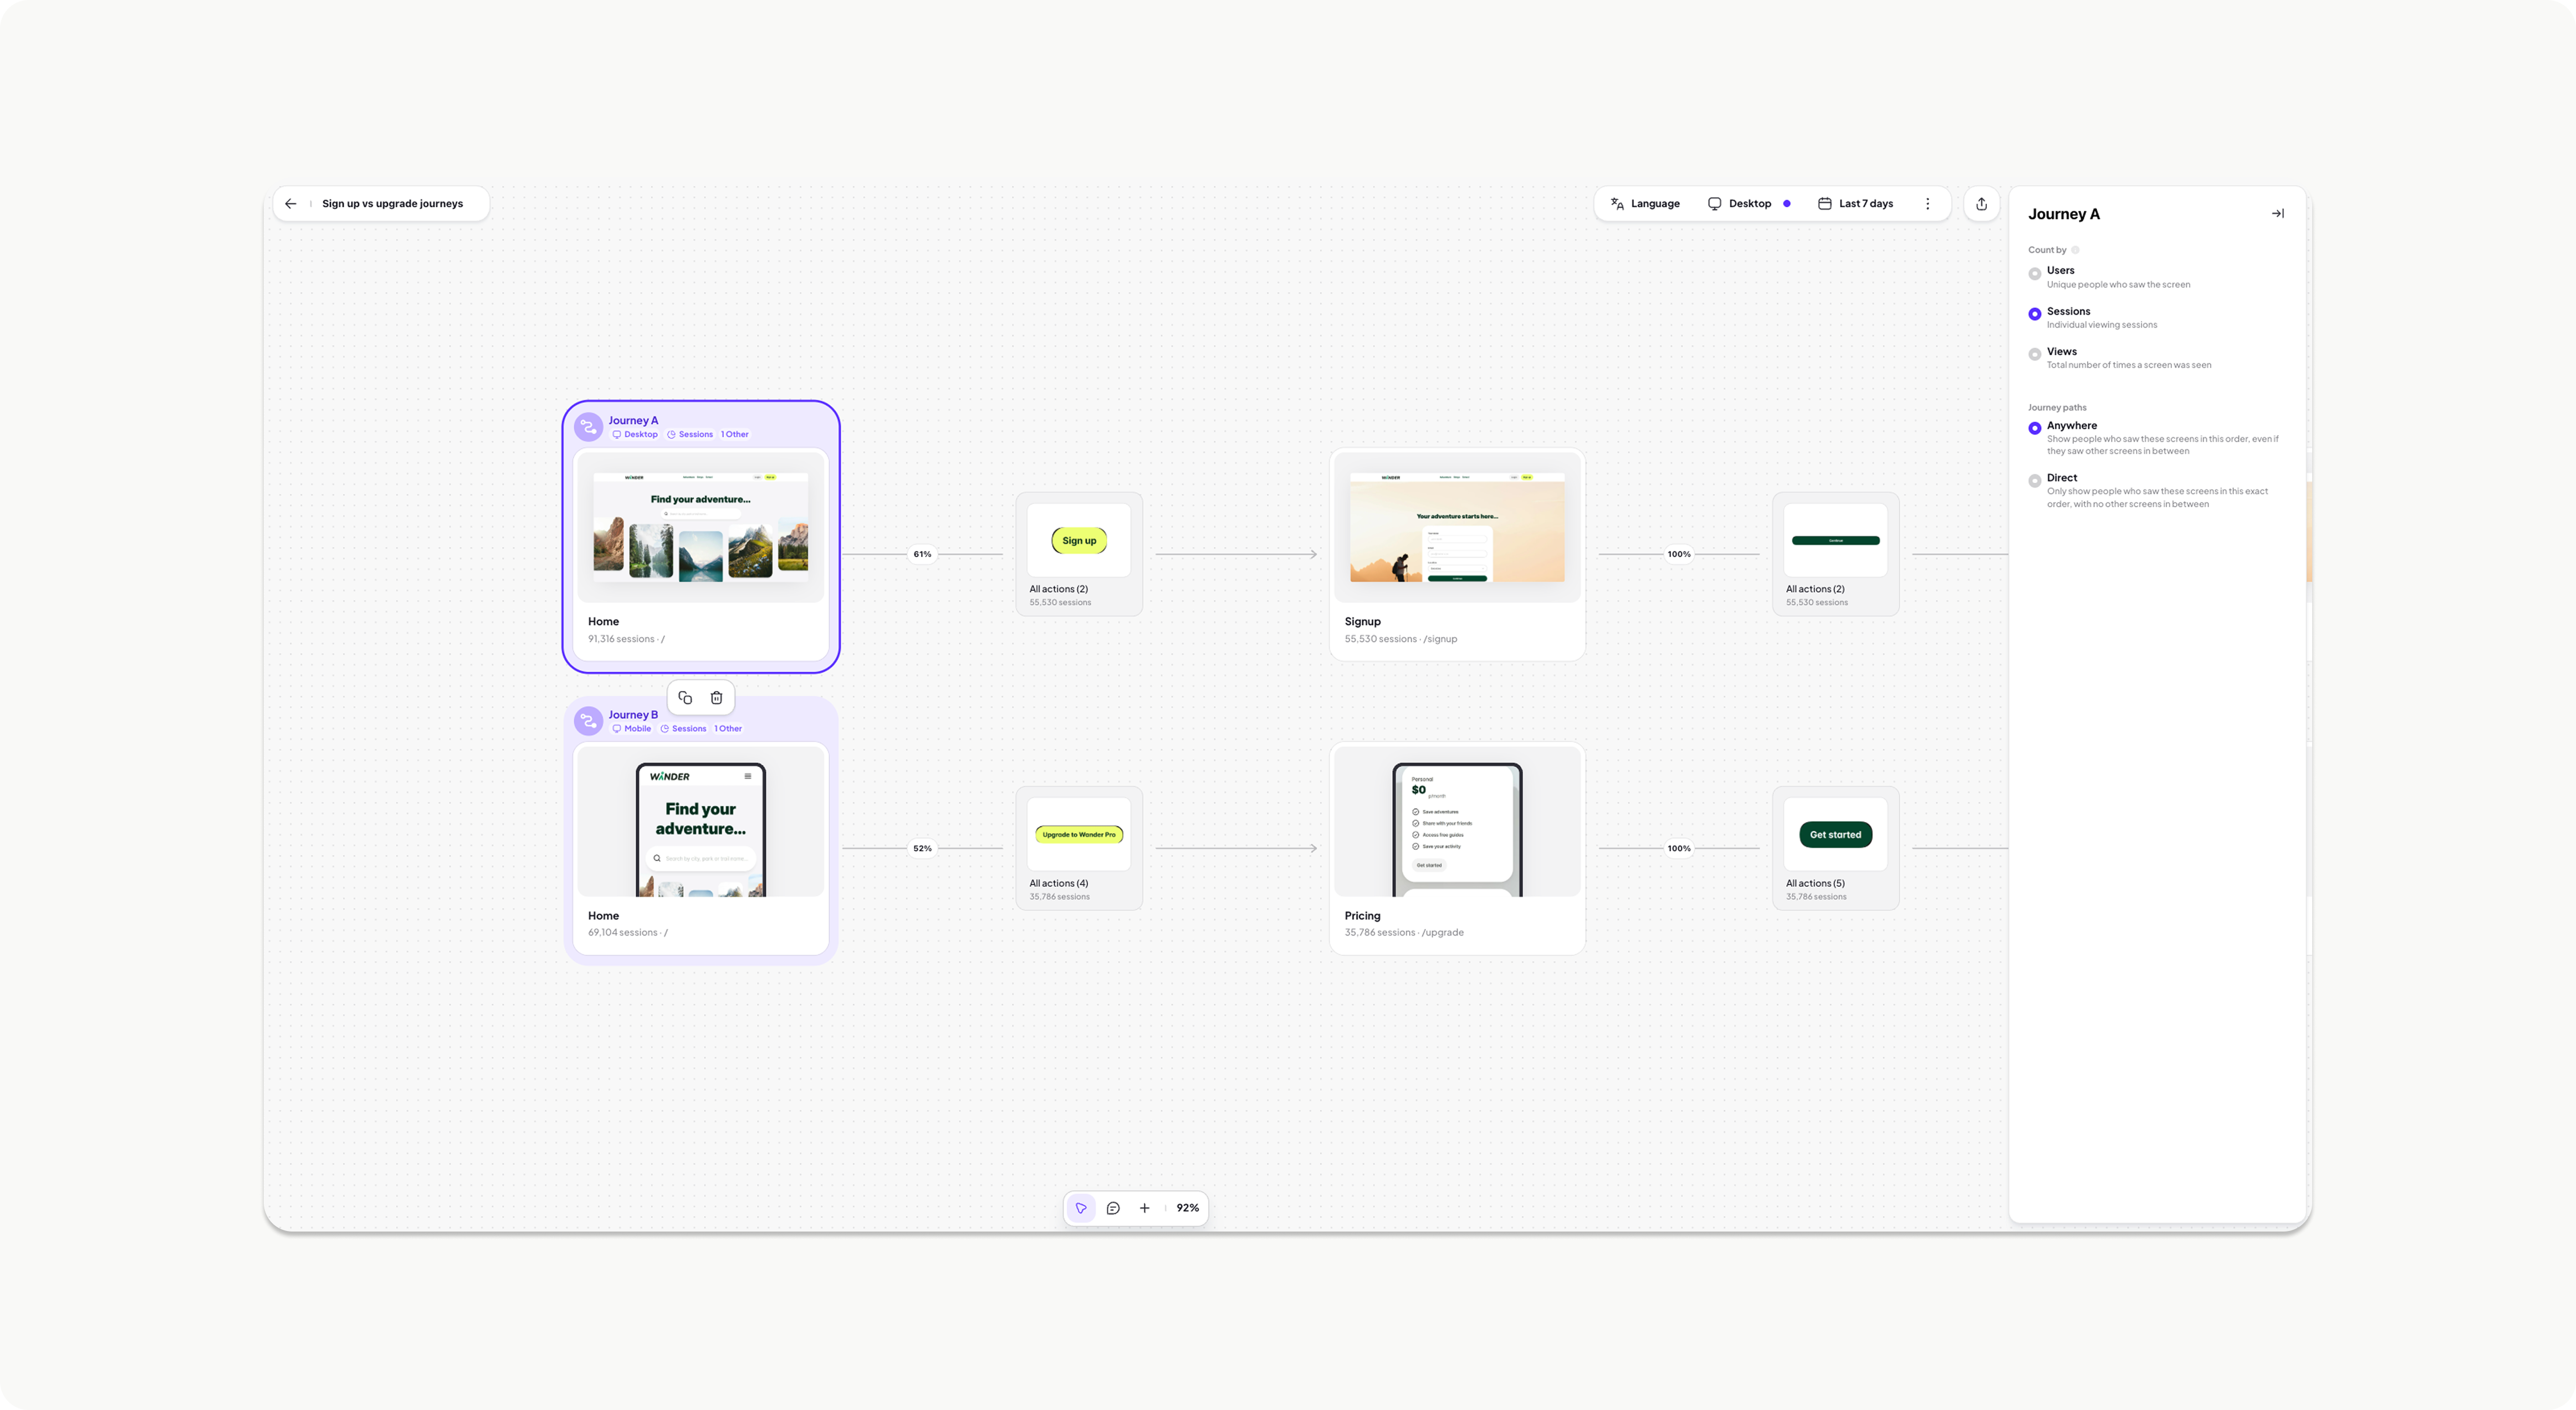
- Select the starting screen (highlighted in purple).
- In the right-hand panel, find the Count By and Journey Path options.
- Adjust them to display your preferred journey metrics.
Count by
1. Users (Unique people who saw the screen) Use it to:- Measure how many distinct users interacted with a screen.
- Track feature adoption and reach.
- Filter out repeat visits to focus on unique engagement.
- Answers: “How many users actually saw this part of the journey?”
- Helps track true adoption rather than inflated view counts.
- Track how often users return to a screen.
- Analyze engagement patterns and drop-offs.
- Measure stickiness or user hesitation.
- Answers: “How frequently do users engage with this screen?”
- Identifies repeat visits vs. friction points.
- Track overall screen traffic, including repeat views.
- Identify high-traffic areas or bottlenecks in user journeys.
- Spot looping behavior or friction points.
- Answers: “How many times has this screen been viewed?”
- Helps detect where users might be getting stuck.
- Users vs. Sessions: Compare these to see if users return across multiple sessions (high engagement) or if they bounce after one visit.
- Sessions vs. Views: If sessions are low but views are high, users may be refreshing the page or looping in frustration.
- Users vs. Views: A big gap means repeat views from the same users, which could indicate high engagement or usability issues depending on your product type
Journey Paths
Anywhere Shows users who saw the specified screens in the chosen order, even if they saw other screens in between. When to use it:- To track broad user flows while allowing for real-world navigation variability.
- To analyze drop-offs or diversions before a key conversion step.
- Helps answer: “Did users eventually reach this screen, even if they took different paths?”
- Captures more realistic product usage since users rarely follow a perfect linear journey.
- Useful for tracking conversion funnels while allowing for organic exploration.
- To track strict, linear flows where deviation could indicate friction or confusion.
- To measure intended user journeys, such as a guided onboarding experience.
- To diagnose unexpected user behavior, like skipping steps in a process.
- Helps answer: “Are users following the intended step-by-step journey, or are they getting distracted?”
- Can highlight where users drop off when expected behavior isn’t followed.
Journey Comparison
Journey Comparison lets you map multiple user journeys on the same board and customize filters for each one. This makes it easy to compare journeys side by side across languages, devices, properties, and timeframes, all in one place. For example, you can analyze onboarding journeys across different devices and languages to see the full product experience at a glance. You can also dive deeper by comparing key metrics, like sessions vs. unique users, to uncover insights and optimize your user experience.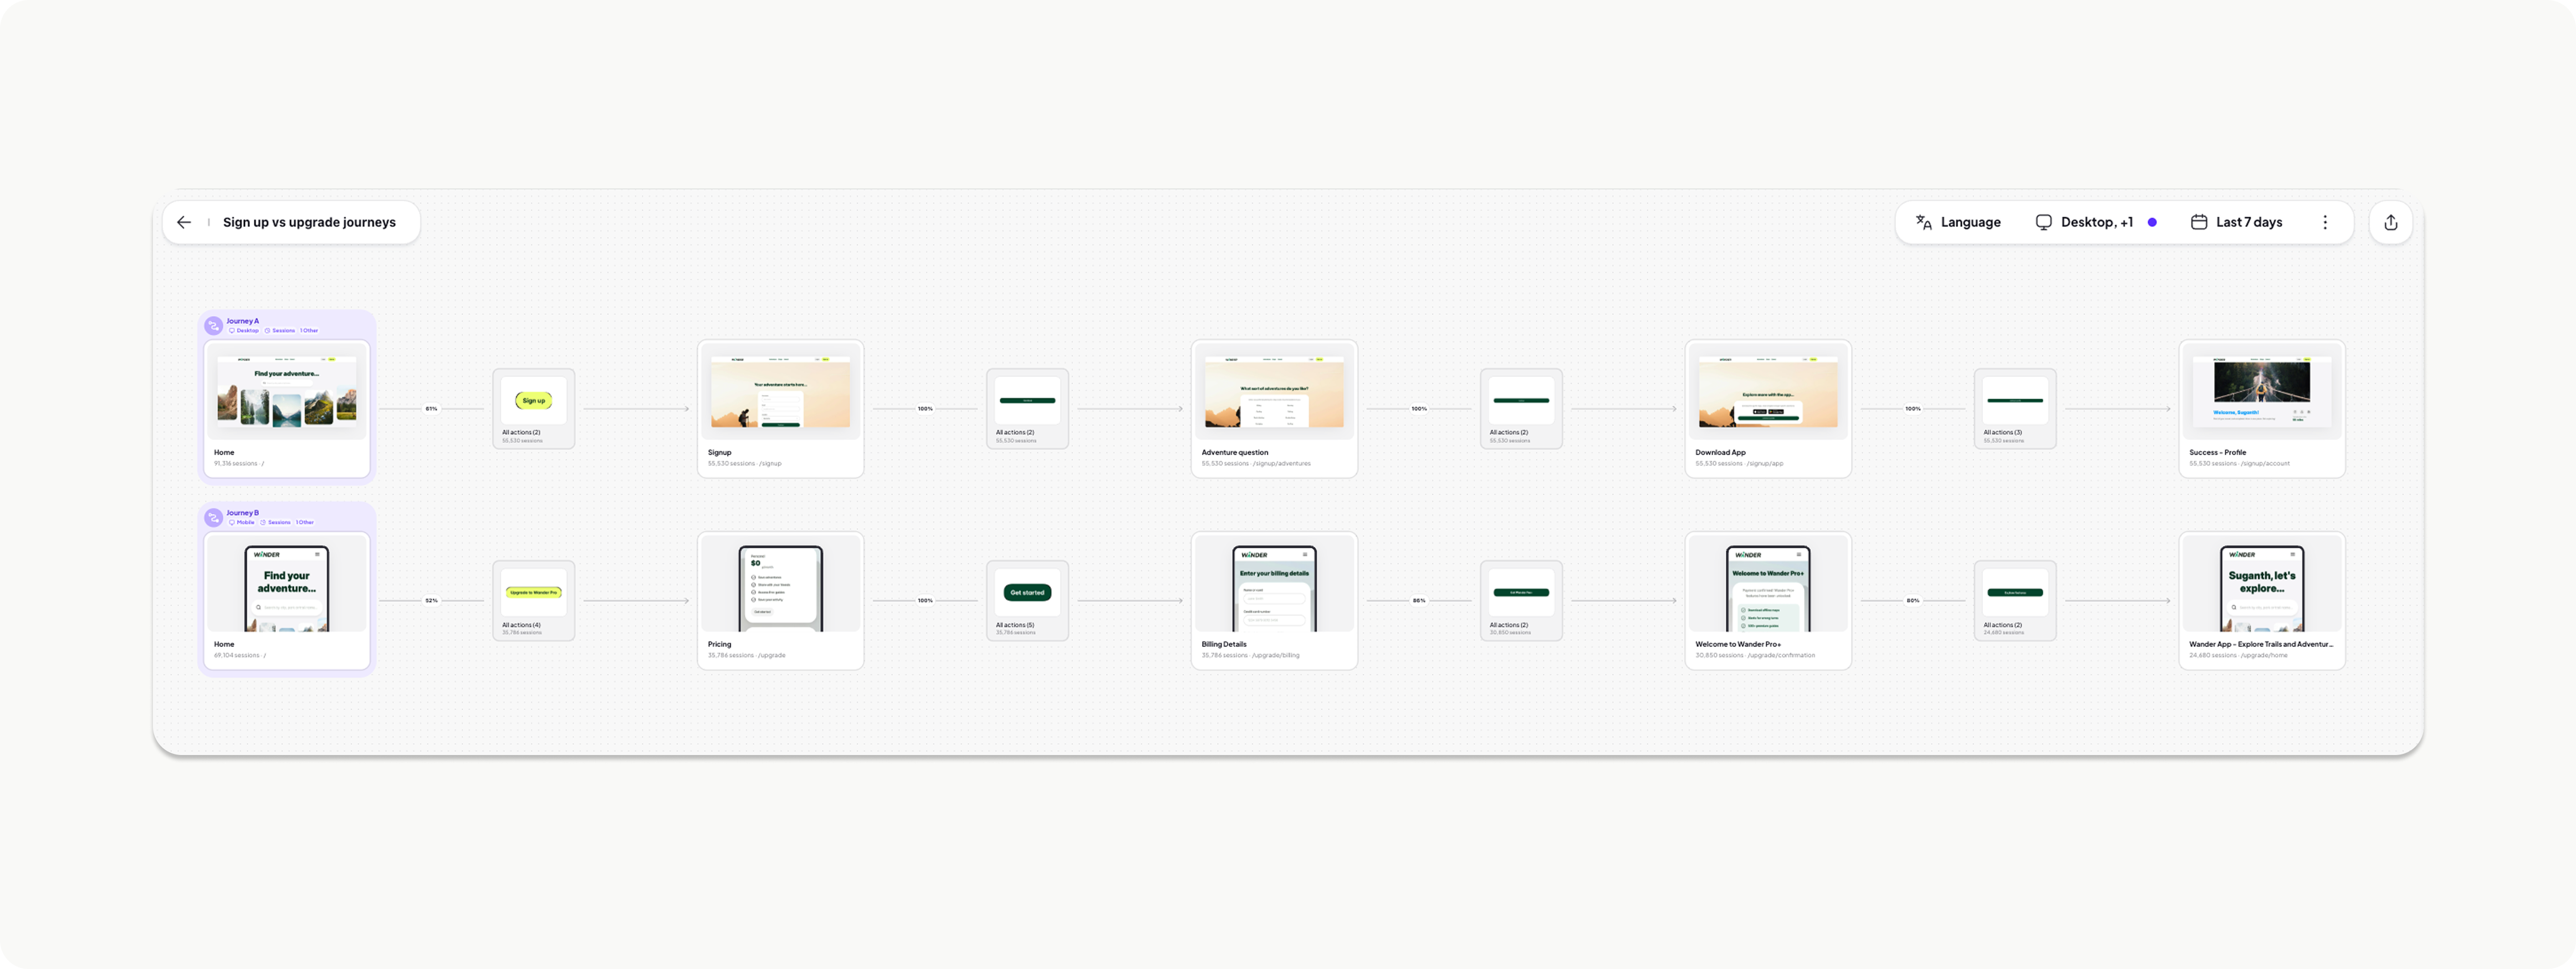
- Open Journeys, then select or create a journey.
- Duplicate the journey to add another comparison.
- Filter the journeys for different parameters, using the filter toolbar. Filter for:
- Device type (desktop vs. mobile)
- Language
- Country
- Property
- Browser
- UserId
- Timeframe
- Explore your journeys side by side
- Ensure consistency across all touchpoints.
- Spot behavior changes between segments.
- Manage all instances of your journeys from one single source of truth.
Cross domain stitching.
If you have your marketing site sitting on one domain and your product experience sitting on a subdomain, Adora automatically stitch the sessions of the user together for you to see the end to end experience. For example users navigating fromwww.adora.so to app.adora.so will show up as a stitched session in Adora.
Sharing a journey
Ready to show off your amazing discoveries to the team? No problem, you’ve got a few simple ways to do it.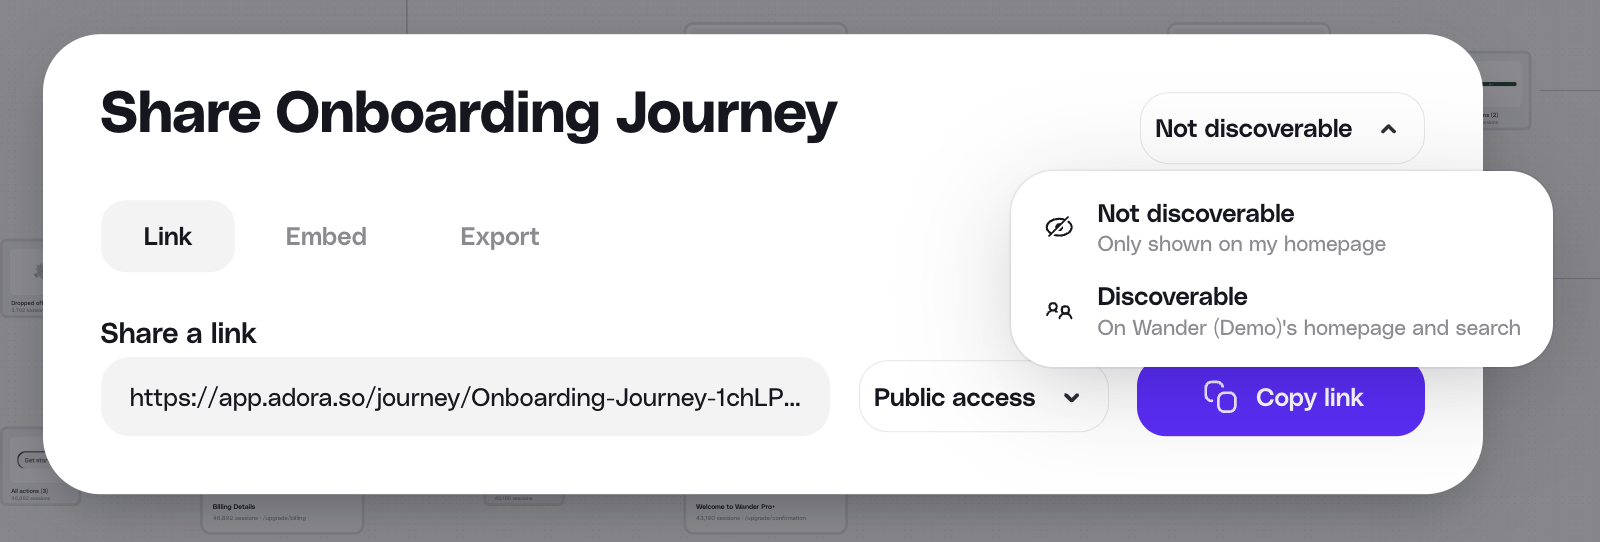
- Sharing: Share any Screen or Journey via the share arrow in the top right corner
- Public: Share a link that anyone can publicly access
- Team Access: Share a link that any teammate in Adora can access
- Journey Discoverability: By default the journeys are not discoverable. To make them discoverable:
- Click the share arrow in the top right
- Select the dropdown and select Discoverable
- Embed: Drop your live journeys or screens directly into tools like Notion or Confluence for seamless knowledge sharing.
- Comment: Comment on specific parts of a journey so team they can jump in, review, make updates, and learn alongside you.