Customer Lifecycle Mapping: From Signup to Expansion
Customer Lifecycle Mapping: From Signup to Expansion
Every user in your product is somewhere in a lifecycle: they just signed up, they are getting oriented, they are becoming a regular user, or they are deciding whether to expand or leave. Understanding where each user is, and what the transitions between stages look like, is customer lifecycle mapping.
Most teams have a vague mental model of the lifecycle. They know users sign up, onboard, use the product, and eventually renew or churn. Customer lifecycle mapping makes that model precise. It defines each stage, identifies the transitions between stages, and measures how effectively users progress through them.
When you combine lifecycle mapping with AI journey data, you get a living model that shows exactly how users move between stages, where they stall, and what interventions drive progression.
The SaaS customer lifecycle
The standard SaaS lifecycle has six stages. Each stage has a defining behavior, a key metric, and a primary risk.
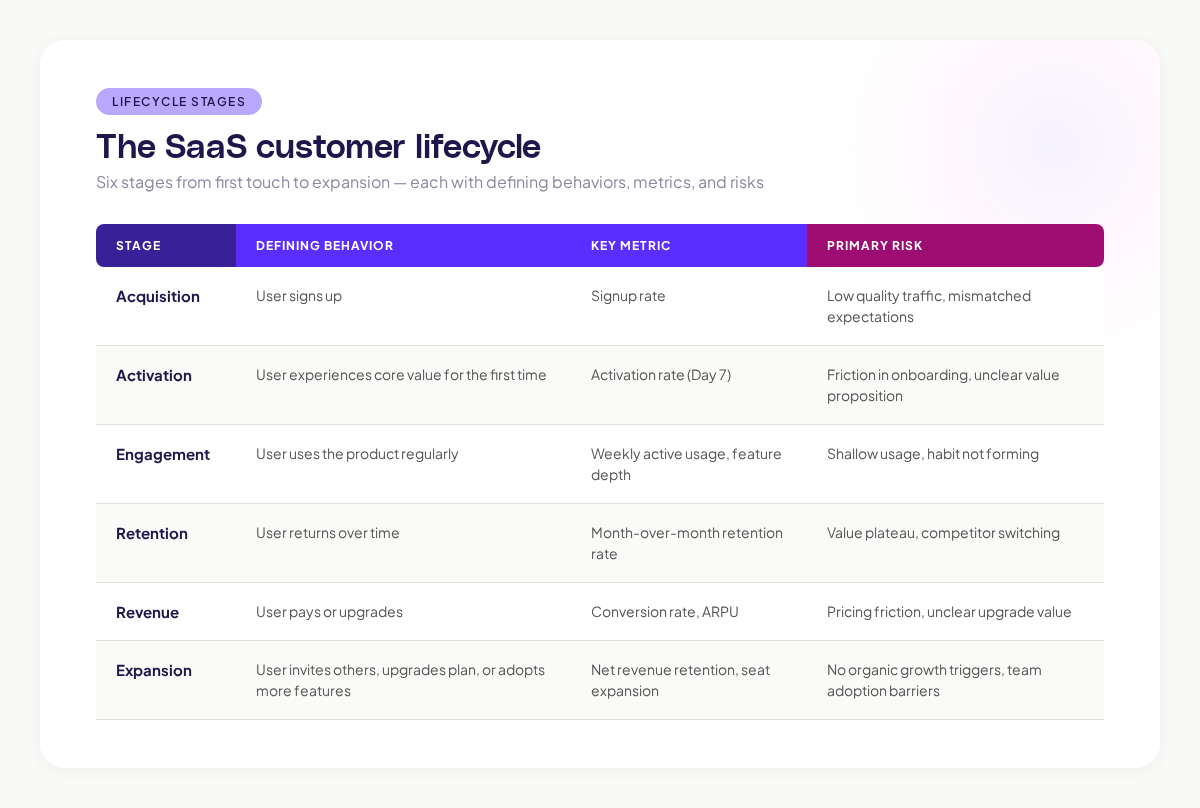
Research from ProfitWell shows that the median SaaS company retains 85% of revenue month-over-month. Companies in the top quartile retain 95%+. The difference is often how well they understand and manage lifecycle transitions.
Mapping lifecycle transitions with journey data
The Critical Transitions
The most important part of lifecycle mapping is not the stages themselves. It is the transitions between them. A user sitting in the Activation stage is neither a success nor a failure. The question is whether they progress to Engagement or fall back to churn.
AI journey data shows you these transitions in granular detail:
Acquisition to Activation: What path do newly signed-up users take to their first value moment? Where do they get stuck? How long does it take?
When I was working at Canva, we tracked this transition obsessively. The journey from signup to first exported design was our critical path. Every unnecessary click, every confusing screen, every moment of hesitation in that path was a potential leak in the lifecycle funnel.
Activation to Engagement: After a user activates, what determines whether they come back? Journey data shows which post-activation behaviors predict return visits. Do users who explore additional features after activation retain better? Do users who invite teammates engage more deeply?
Engagement to Retention: What keeps engaged users from leaving? Journey data reveals the “habit loops” that drive retention: the regular workflows users perform, the triggers that bring them back, and the moments where engagement starts to decline.
Retention to Expansion: What triggers expansion? Journey data shows which behaviors precede upgrades, team invitations, and feature adoption. These behavioral predictors are your growth levers.
Mapping the Anti-Transitions
Just as important as understanding progression is understanding regression. Where do users fall backward in the lifecycle?
- Engagement to Disengagement: Users who were active begin visiting less frequently. Journey data shows changes in their usage patterns before they fully disengage. This is your early warning system.
- Retention to Churn: Users who have been loyal show warning signs: shorter sessions, fewer features used, more friction signals. Journey mapping catches these patterns.
Research consistently shows that a significant portion of B2B churn is preventable when caught early enough. The challenge is detecting disengagement before the user has mentally checked out. Journey data provides exactly that kind of early detection mechanism.
Building your lifecycle map
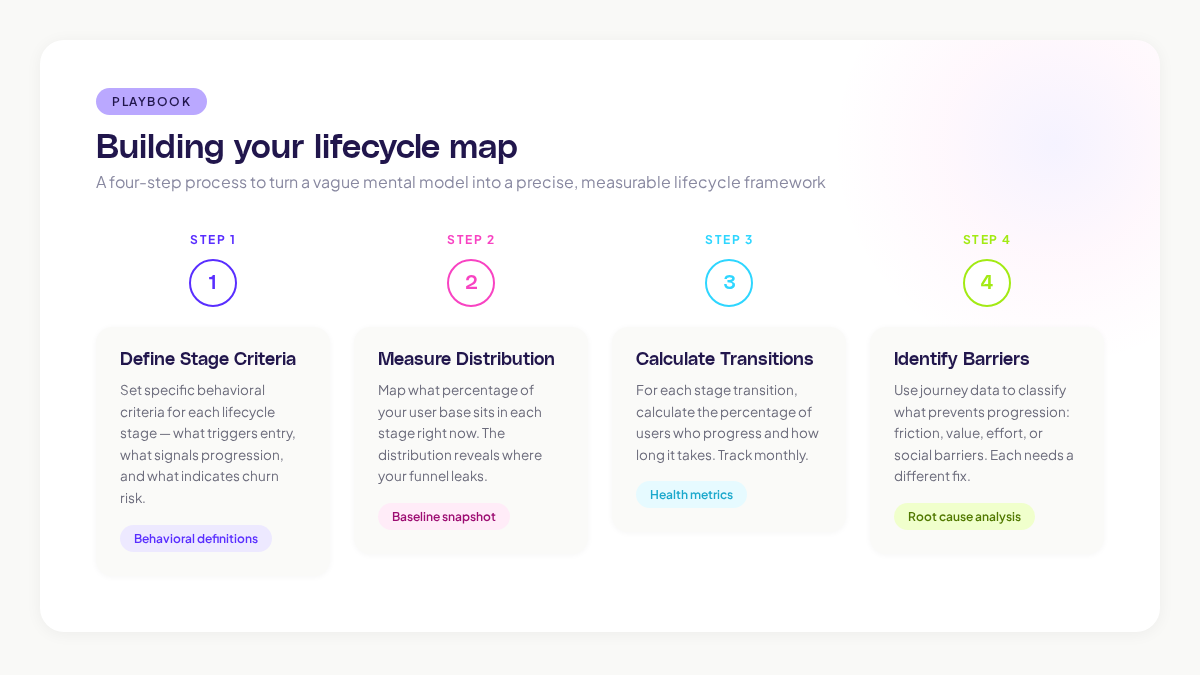
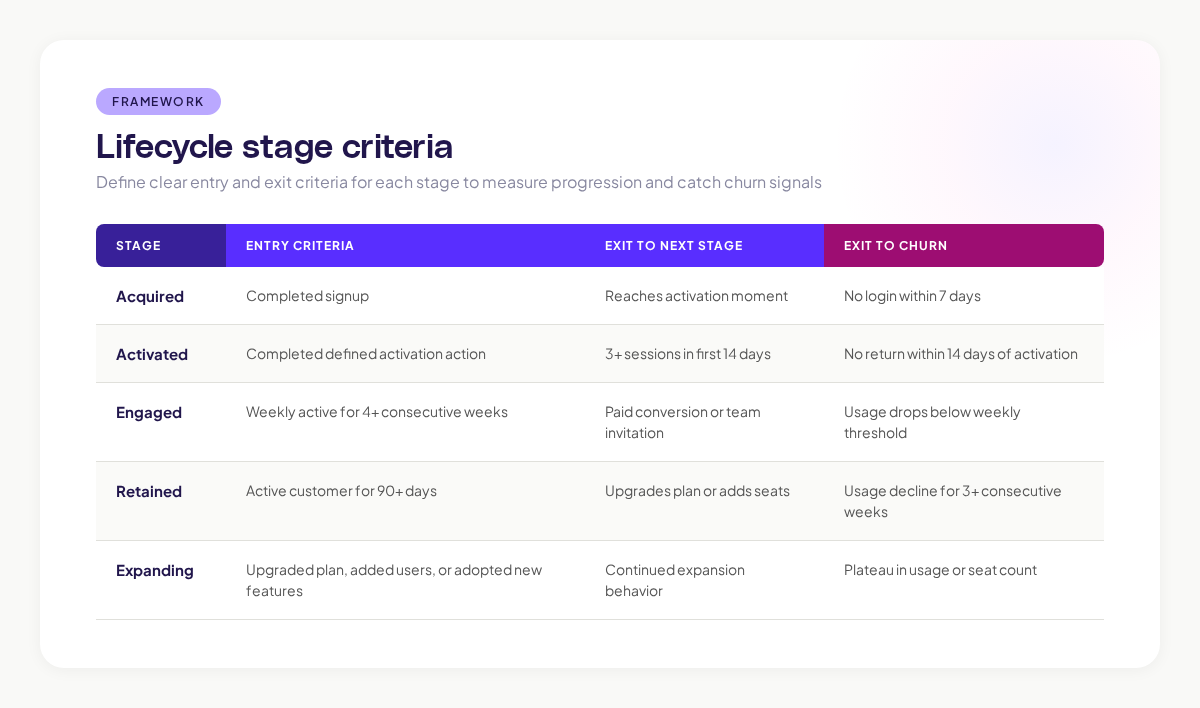
Step 1: Define Stage Criteria
For each lifecycle stage, set specific behavioral criteria:
Step 2: Measure Stage Distribution
At any given time, what percentage of your user base is in each stage?
A healthy SaaS lifecycle distribution looks roughly like:
- Acquired (not yet activated): 30-40%
- Activated: 15-20%
- Engaged: 20-25%
- Retained: 15-20%
- Expanding: 5-10%
If your Acquired stage is disproportionately large, you have an activation problem. If Engaged is large but Retained is small, you have a stickiness problem. The distribution tells you where to focus.
Step 3: Calculate Transition Rates
For each stage transition, calculate the percentage of users who progress:
- Acquired to Activated: what percentage? In how many days?
- Activated to Engaged: what percentage? In how many weeks?
- Engaged to Retained: what percentage? Over what time period?
These transition rates are your lifecycle health metrics. Track them monthly. Set alerts for significant drops.
Step 4: Identify Transition Barriers
Use journey data to identify what prevents users from progressing:
- Friction barriers: UX problems, confusing flows, technical errors
- Value barriers: Users do not see enough value to progress (feature gaps, unclear benefits)
- Effort barriers: Too much work required to reach the next stage (complex setup, manual configuration)
- Social barriers: Progression requires actions involving other people (invitations, approvals)
Each barrier type needs a different intervention. Friction barriers need UX fixes. Value barriers need better feature communication or product improvements. Effort barriers need simplification. Social barriers need lower-friction social mechanisms.
Adora’s journey analytics helps identify these barriers by showing you exactly where users stall between lifecycle stages, with behavioral signals that indicate what type of barrier they are encountering.
Lifecycle optimization strategies
For Acquisition to Activation
This is the highest-leverage transition to optimize. Every percentage point improvement here compounds across the entire lifecycle.
- Reduce time to activation (fewer steps, less configuration)
- Provide sample data or templates so users can experience value before setting up
- Add progress indicators so users know how close they are to the value moment
- Remove any step that is not strictly necessary before the activation moment
For Activation to Engagement
- Surface additional features after activation (progressive disclosure)
- Create “next best action” prompts that guide users deeper into the product
- Build habit triggers: recurring workflows, notifications, scheduled reports
- Make the product better with more usage (network effects, personalization)
For Engagement to Retention
- Monitor for early warning signals (declining session frequency, shrinking feature usage)
- Build switching costs: integrations, team workflows, accumulated data
- Continuously deliver new value through product updates and feature launches
- Create community connections (user forums, shared workspaces, collaborative features)
For Retention to Expansion
- Identify organic growth triggers (features that naturally involve other people)
- Make team invitation frictionless (one-click sharing, auto-provisioning)
- Surface upgrade prompts when users hit plan limits naturally, not arbitrarily
- Create expansion paths that align with the user’s growing needs
McKinsey’s research on SaaS growth found that net revenue retention above 120% is the strongest predictor of long-term SaaS success. Optimizing the Retention-to-Expansion transition directly drives NRR.
Key takeaways
Customer lifecycle mapping turns a vague understanding of user progression into a precise, measurable model. Define your stages, measure your transitions, identify your barriers, and optimize systematically.
The biggest insight from lifecycle mapping is usually where users stall. Most products do not lose users because the product is bad. They lose users because the transition from one stage to the next requires too much effort, too much time, or too much luck.
AI journey data makes lifecycle mapping actionable by showing you exactly what happens at each transition. You can see which paths lead to progression, which paths lead to regression, and what interventions drive the biggest improvements.
Start by defining your lifecycle stages and measuring your current transition rates. That baseline alone will reveal where your product’s biggest growth opportunity lives.
Related posts

Why We Built AI Product Insights
The story behind Adora's AI Insights, and why I think this is the future of how product teams operate.

Data-driven off a cliff: why dashboards are dead
Dashboards are dead. Not because data doesn't matter. But because the way we've been accessing it was never actually built for the people making product decisions. Here's what went wrong, and what comes next.

SaaS Pricing Pages to Sign Up Journeys
This teardown analyzes SaaS pricing pages and their connected sign up journeys. Learn how leading SaaS companies design pricing, CTAs, and sign up flows that reduce friction and increase conversion.