Event Analytics vs Journey Analytics: Which Tells the Real Story
Event Analytics vs Journey Analytics: Which Tells the Real Story
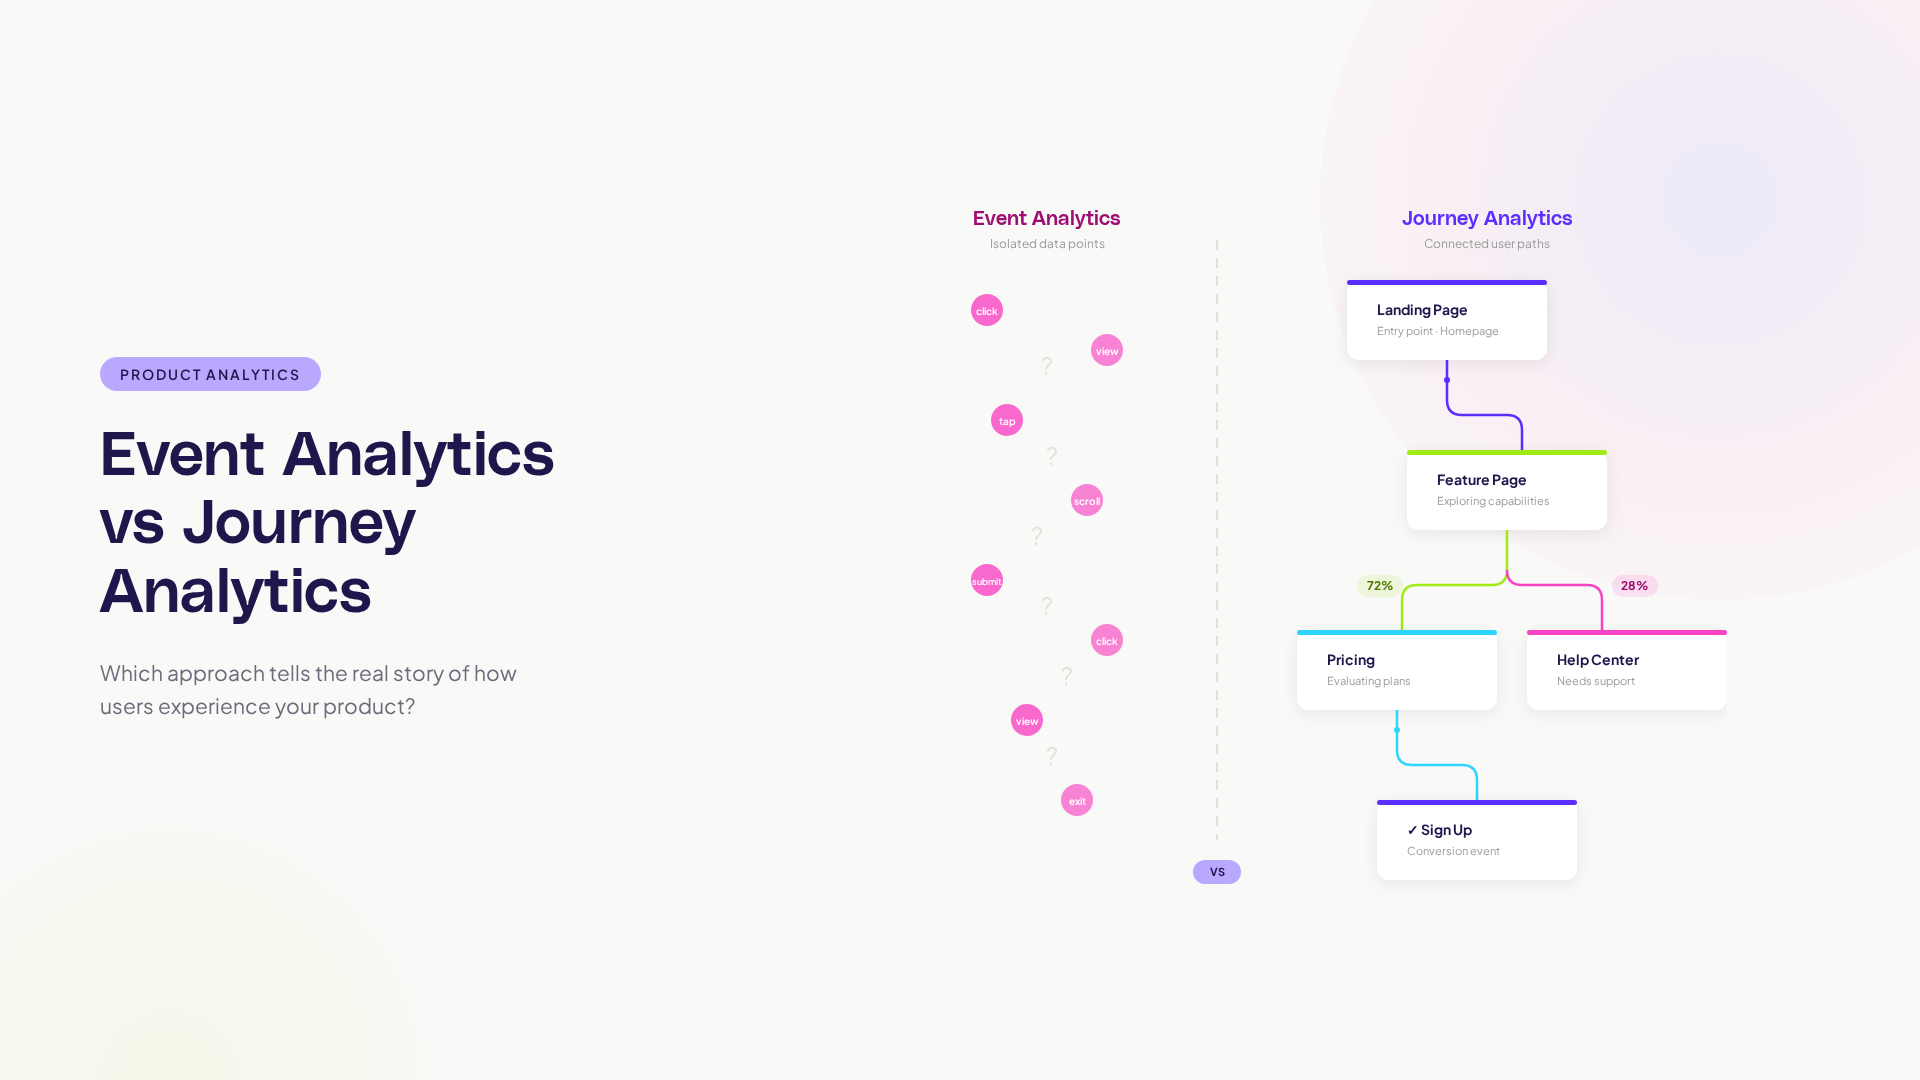
If you work in product, you have lived inside event analytics. Every button click, page view, feature toggle, and form submission tracked, counted, and graphed. Event analytics is the foundation of modern product development. It tells you what happened and how often.
Journey analytics takes a fundamentally different approach. Instead of counting isolated events, it tracks the sequences of events: what happened first, then next, then after that. It tells you the story of how users move through your product, not just which individual interactions occurred.
Both approaches are valuable. They answer different questions. This guide compares them directly so you can decide where to invest your attention.
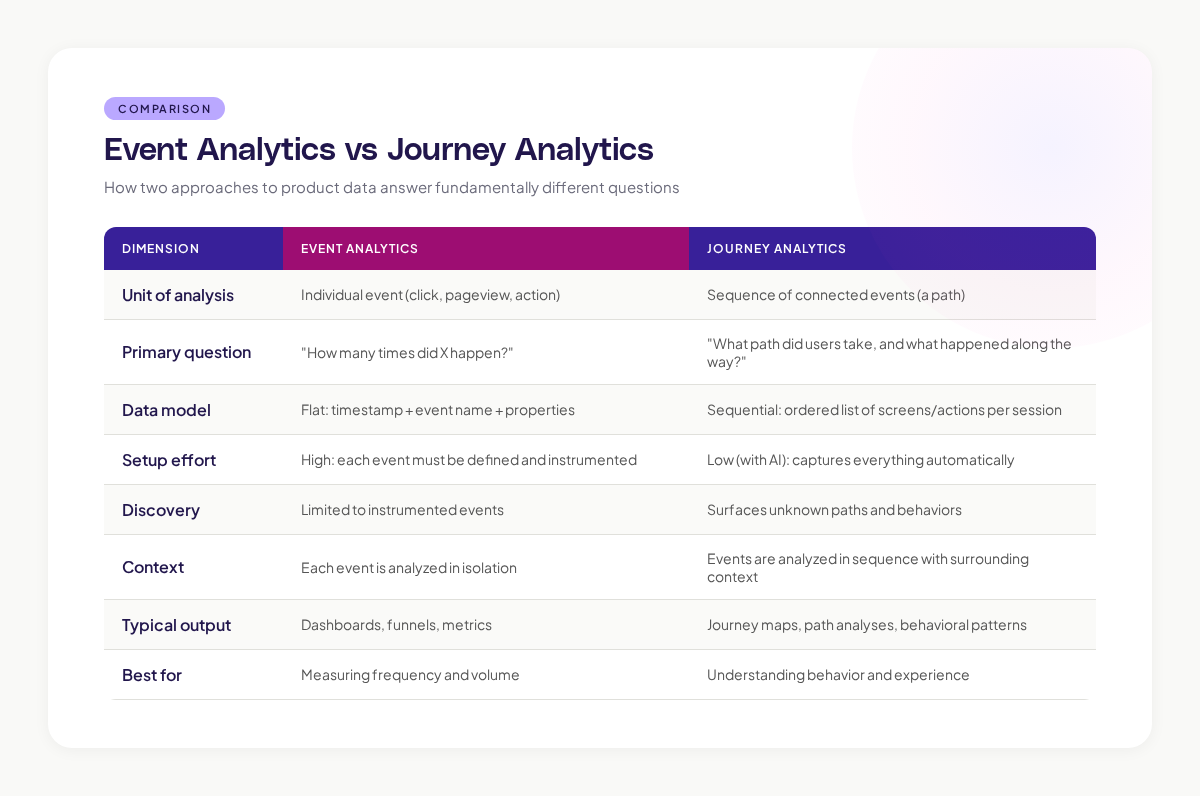
TL;DR comparison
What event analytics does well
Precise Measurement
Event analytics excels at counting specific things with high precision. How many users clicked "Sign Up" today? How many projects were created this week? What is the conversion rate from free to paid? These are event-level questions, and event analytics answers them cleanly.
Time-Series Tracking
Events are timestamped, making them ideal for time-series analysis. You can track how a specific metric changes over days, weeks, and months. Trends and anomalies become visible.
Custom Instrumentation
Event analytics lets you define exactly what you want to track. If you care about a specific button click or form submission, you can instrument it precisely and measure it with confidence.
Google's HEART framework (Happiness, Engagement, Adoption, Retention, Task success) was designed around event-level metrics. It works well for measuring specific outcomes and tracking them over time.
Where event analytics falls short
The Context Gap
Event analytics tells you that 1,000 users clicked "Upgrade" today. It does not tell you what those users did in the 20 minutes before clicking. Were they exploring features? Reading pricing? Hitting a plan limit? The same event (clicking "Upgrade") has completely different meaning depending on the journey that preceded it.
The Discovery Gap
You can only track events you have instrumented. If you did not think to track a specific interaction, it is invisible. This creates a fundamental blind spot: you cannot discover unexpected user behaviors because you are only measuring expected ones.
A concrete example from building products: at Canva, we had extensive event tracking for our design editor. But we had not instrumented the specific interaction of users copying elements between designs. When we finally tracked it, we discovered it was one of the most frequent actions in the product. It had been invisible to our analytics for months.
The Sequence Gap
Event analytics treats each event independently. It can tell you that the same user clicked "Edit Project" and later clicked "Share Project." It cannot easily tell you what happened between those two events, how long the full sequence took, or whether the path between them was smooth or frustrating.
Building funnels partially addresses this, but funnels are rigid: you define the steps in advance, and the funnel only measures those specific steps in that specific order. Real user behavior rarely follows rigid sequences.
What journey analytics does differently
Captures the Full Story
Journey analytics records complete user sessions as sequences of screens and actions. Every transition, every detour, every backtrack is captured. You see the full story of each user's experience, not just the highlighted moments.
Discovers Unknown Behavior
Because journey analytics captures everything (especially with AI-powered approaches that require no manual instrumentation), it surfaces behavior patterns you did not anticipate. Workaround journeys, unexpected feature usage, navigation paths nobody designed.
Nielsen Norman Group's research on user behavior consistently finds that users interact with products in ways designers did not intend. Journey analytics makes these unintended interactions visible.
Provides Behavioral Context
Every event in a journey has context: what came before it and what comes after it. This context is essential for understanding user intent and experience quality.
A "help page view" means different things depending on context:
- Viewed from the onboarding flow: user is confused about setup
- Viewed from a feature page: user needs documentation for a specific feature
- Viewed from the error page: user encountered a problem and is seeking help
Event analytics counts all three as "help page view = 1." Journey analytics distinguishes them because it knows the surrounding path.
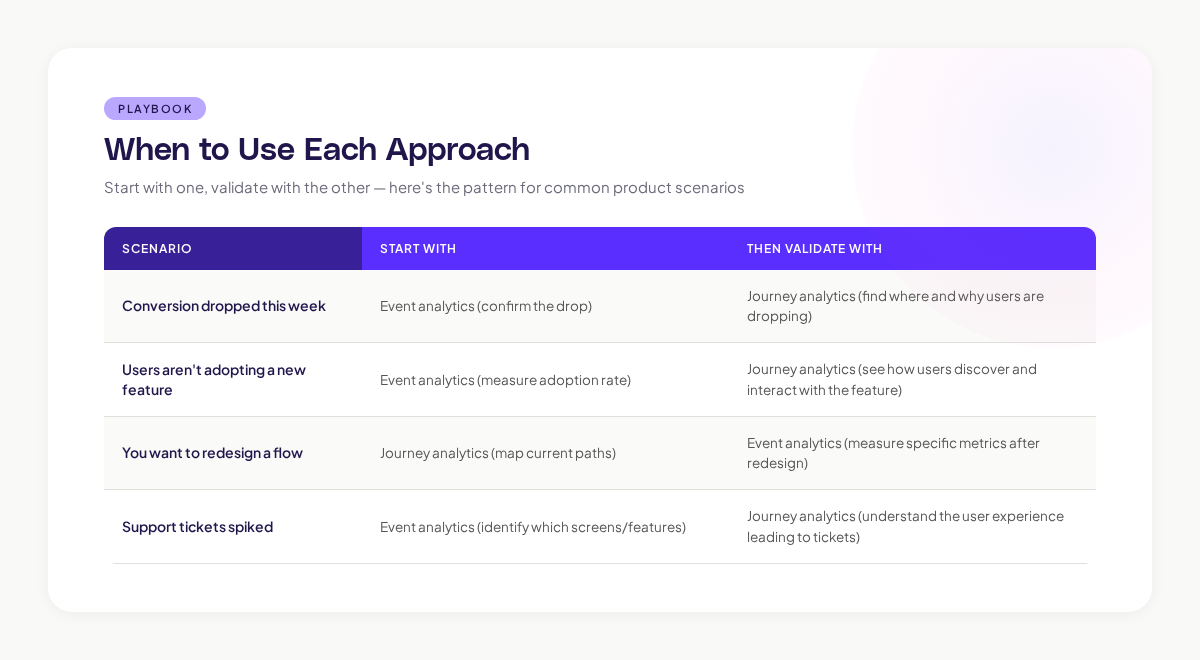
When to use each approach
Use Event Analytics When You Need To:
- Track a specific metric over time (conversion rate, signup count, feature usage)
- Measure the impact of a specific change on a specific metric
- Set up alerts for metric thresholds (signups drop below X, error rate exceeds Y)
- Report to stakeholders who need simple, numeric updates
Use Journey Analytics When You Need To:
- Understand why a metric changed (not just that it changed)
- Discover how users actually navigate your product
- Diagnose where users struggle in multi-step flows
- Compare how different user segments experience the same features
- Find unexpected behavior patterns and unmet needs
Using both together
Event analytics and journey analytics are complementary. Event analytics tells you the score. Journey analytics tells you the game. You need both.
Getting your team setup with both
Most product teams start with event analytics because it is the established practice. Adding journey analytics does not replace your event tracking. It adds a layer of behavioral context that makes your event data more useful.
Here is what the combined approach looks like:
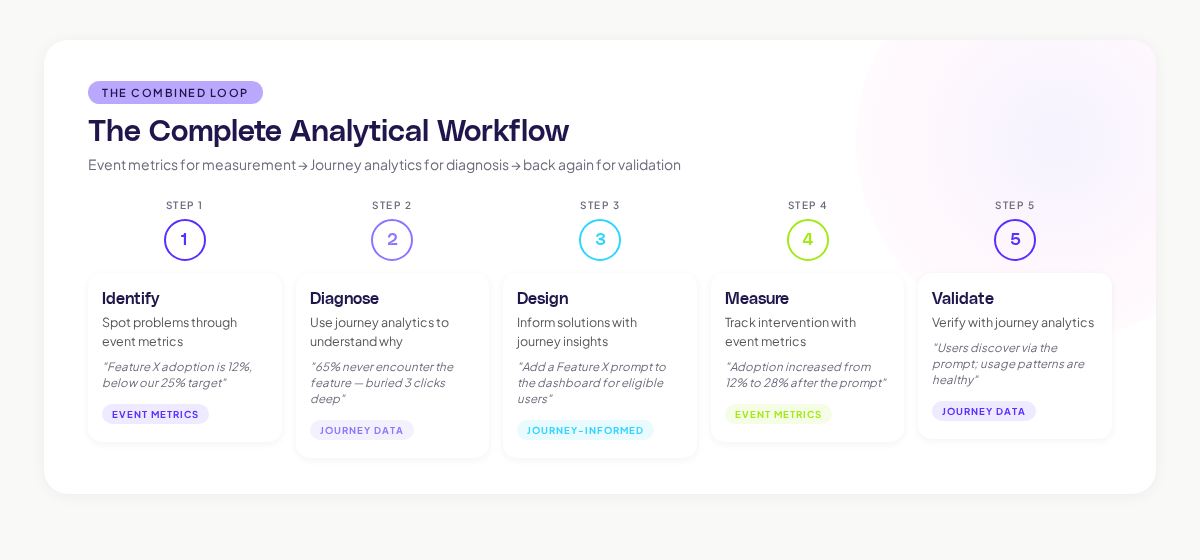
Step 1: Identify a problem through event metrics. "Feature X adoption is 12%, below our 25% target."
Step 2: Use journey analytics to diagnose. "Journey data shows that 65% of users who could use Feature X never encounter it because it is three clicks deep in a submenu. Of the 35% who find it, 60% activate it. Discovery is the problem, not the feature itself."
Step 3: Design an intervention informed by journey data. "Add a Feature X prompt to the dashboard for users who have completed the prerequisite workflow."
Step 4: Measure the intervention through event metrics. "Feature X adoption increased from 12% to 28% after adding the dashboard prompt."
Step 5: Validate through journey analytics. "Journey data confirms that users are discovering Feature X through the new prompt, and usage patterns are healthy (no increase in friction signals)."
This loop, event metrics for measurement, journey analytics for diagnosis, event metrics for validation, journey analytics for verification, is the complete analytical workflow for product teams.
Adora provides the journey analytics layer that most product teams are missing: automated path capture, behavioral signal overlay, and AI-powered pattern detection that complements your existing event tracking setup.
Event analytics and journey analytics answer different questions. Events tell you what happened and how often. Journeys tell you the sequence, the context, and the experience.
Most product teams over-index on event analytics because it is what they know. Adding journey analytics does not require removing anything. It requires adding a behavioral sequence layer that makes your existing data more actionable.
The practical approach: use event metrics to detect problems and measure outcomes. Use journey analytics to diagnose problems and design solutions. The combination produces better product decisions than either approach alone.
If your team is making decisions based on event metrics without understanding the journeys behind those metrics, you are working with half the picture. Journey analytics fills in the other half.
Related posts

Why We Built AI Product Insights
The story behind Adora's AI Insights, and why I think this is the future of how product teams operate.

Data-driven off a cliff: why dashboards are dead
Dashboards are dead. Not because data doesn't matter. But because the way we've been accessing it was never actually built for the people making product decisions. Here's what went wrong, and what comes next.

SaaS Pricing Pages to Sign Up Journeys
This teardown analyzes SaaS pricing pages and their connected sign up journeys. Learn how leading SaaS companies design pricing, CTAs, and sign up flows that reduce friction and increase conversion.