Funnel Optimization with AI Journey Analytics
Funnel Optimization with AI Journey Analytics
Traditional funnel optimization works like this: you define 4-5 steps, measure conversion between each step, and try to improve the worst drop-off. The problem is that funnels are a simplification. Users do not move through your product in a straight line. They skip steps, take detours, come back later, and follow paths you never anticipated.
When you optimize a funnel without understanding the actual journeys users take through it, you are optimizing a ‘mental model’ of your product, not the product itself.
AI journey intelligence changes the game by showing you what actually happens between each funnel step. Not just where users drop off, but where they go instead, what they tried before giving up, and which alternative paths lead to the same outcome more reliably.
This guide walks through how to combine funnel optimization with journey intelligence to find and fix the real reasons users do not convert.
Why funnels can mislead you
A traditional funnel has a fundamental design flaw: it assumes a linear path. Step 1 leads to Step 2, which leads to Step 3, which leads to conversion. Users who do not follow this sequence are counted as "drop-offs."
That framing hides critical information.
Consider a SaaS trial funnel: Signup > Setup > First Action > Invite Team > Upgrade. If 40% of users drop off between Setup and First Action, a traditional funnel tells you to fix the Setup-to-First-Action transition. Simple enough.
But what if journey data reveals that those 40% did not actually leave? What if 25% of them went to your help documentation, spent time reading, then returned and completed their first action two days later? And what if 10% went to your pricing page to understand costs before continuing?
These are not drop-offs. They are detours. And they require completely different interventions than a broken flow.
Research from the Baymard Institute found that 58% of US consumers abandoned a cart in the last steps, not because the checkout was broken, but because they were comparison shopping, checking prices, or not ready to buy. If you treated every one of those as a "checkout problem," you would waste resources fixing something that is not broken.
The journey-informed funnel: a better model
Instead of treating your funnel as a linear sequence, treat it as a network of paths that lead to the same destination. Here is the framework:
Step 1: Define conversion endpoints (Not Steps)
Start with outcomes, not steps. What does conversion look like? For a B2B SaaS product, you might have multiple conversion endpoints:
- Trial to paid conversion
- Free plan to paid plan upgrade
- Single user to team account expansion
- First feature use to habitual use
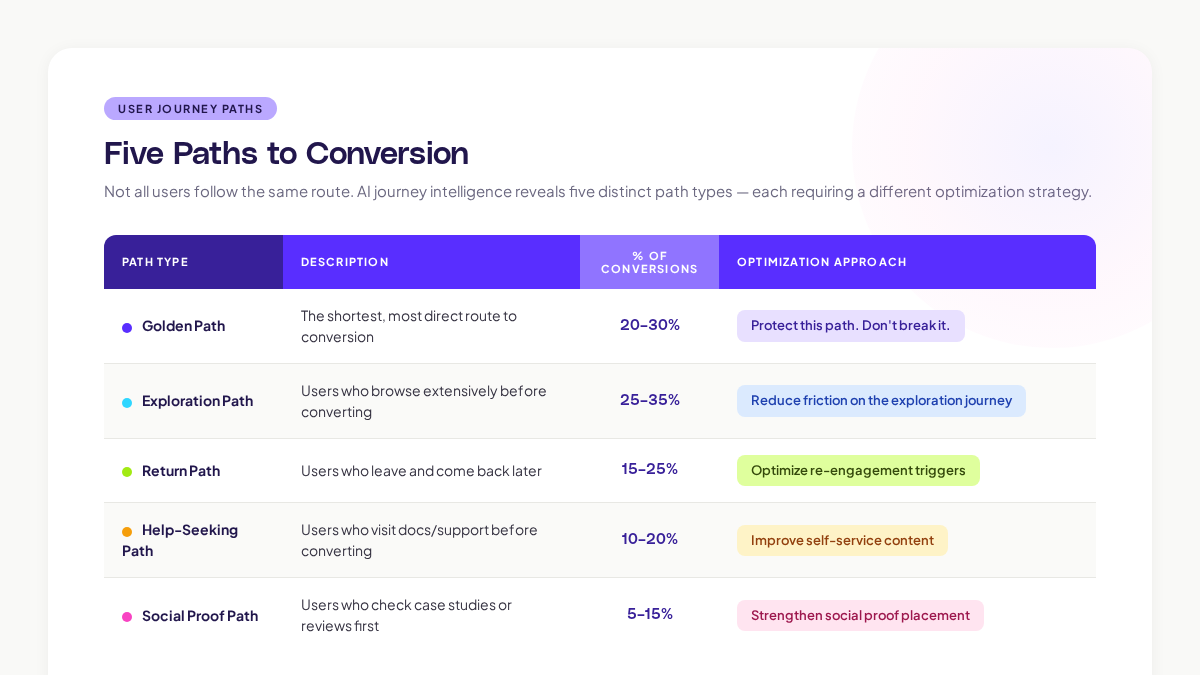
Each endpoint has multiple paths leading to it. Your job is to discover those paths, not prescribe them.
Step 2: Map All Paths to Each Endpoint
Either manually or using AI journey data, map every path that users take to reach each conversion endpoint. You will typically find:
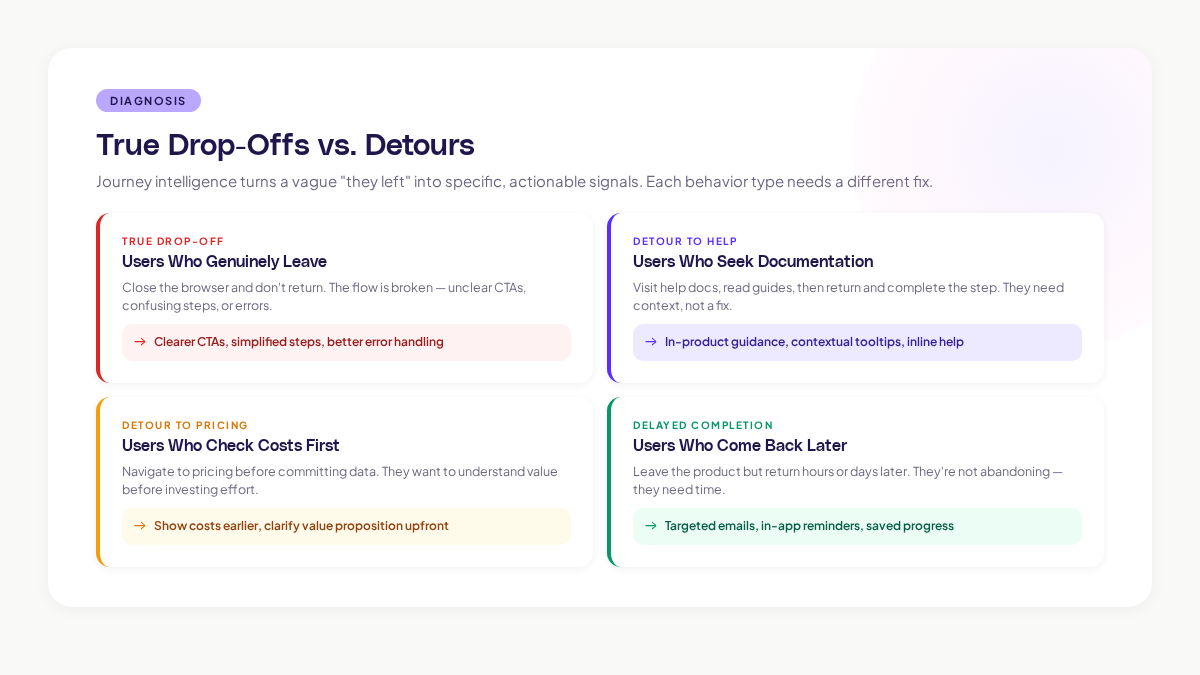
Step 3: Identify True Drop-Offs vs. Detours
With journey data, you can distinguish between users who genuinely leave (close the browser, do not return) and users who take a detour (visit another page, come back later, or reach the same endpoint through an alternative path).
This distinction is critical for prioritization:
Step 4: Fix the Highest-Impact Friction Points
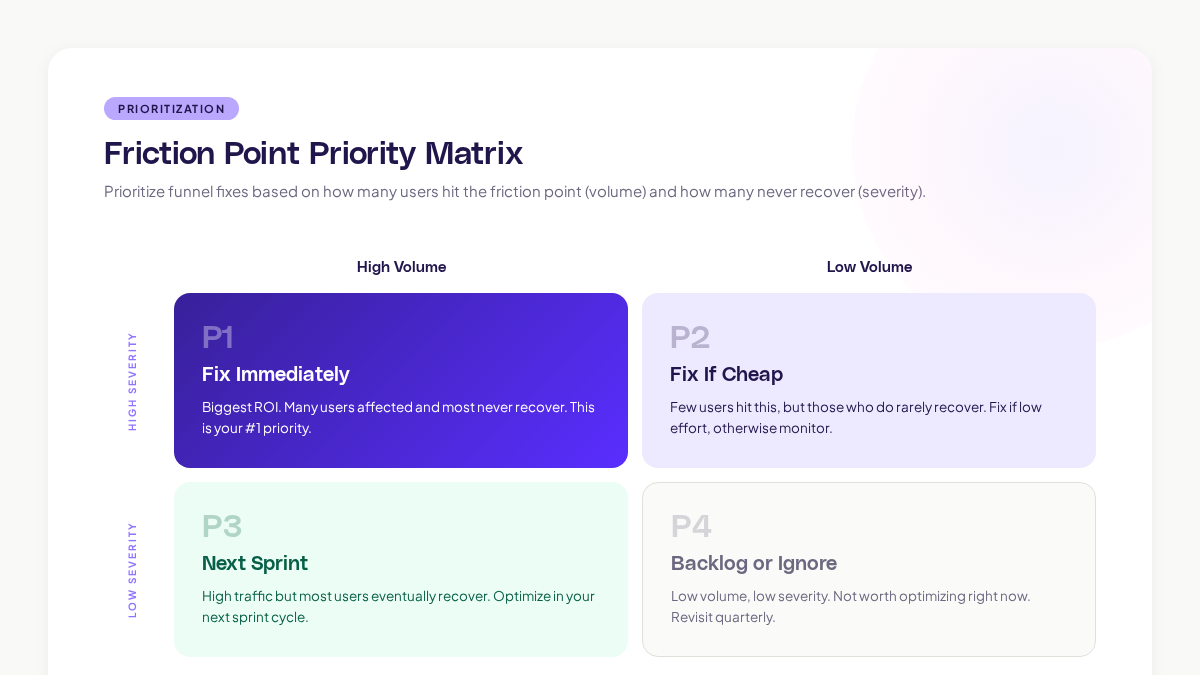
Not all friction points are equal. Prioritize based on:
- Volume: How many users hit this friction point?
- Severity: What percentage of users who hit it never recover?
- Proximity to conversion: How close to the conversion endpoint does it occur? (Friction near the end of the funnel is more costly than friction at the top)
Here is a prioritization matrix:
Step 5: Measure Journey-Level Impact
After making a change, do not just measure whether the step-level conversion improved. Measure whether the overall journey improved:
- Did journey completion rate increase?
- Did the average number of steps to conversion decrease?
- Did behavioral friction signals (rage clicks, loops) decrease at the changed step?
- Did the change inadvertently create friction elsewhere in the journey?
That last question is important. Funnel optimizations can have unintended consequences. Simplifying Step 3 might push confusion to Step 4. Journey-level measurement catches these cascading effects.
Five funnel optimization techniques
Technique 1: Reverse Funnel Analysis
Instead of starting at the top of the funnel and asking "where do people drop off?", start at the bottom and ask "what did the people who converted actually do?"
Pull the journeys of your converted users and look for common patterns. Which screens did they visit? In what order? How long did they spend at each step? What actions did they take?
Then compare those journeys to the journeys of non-converters. The differences are your optimization targets.
To illustrate: imagine you discover that most users who converted had used your search function during onboarding, while hardly any non-converters had. If search is not part of your official onboarding flow, adding a search prompt could meaningfully lift conversion. The insight comes from looking at the journeys of converters backward, not from looking at the funnel forward.
Technique 2: Friction Mapping
Use behavioral signals to create a friction heat map across your funnel. Plot rage clicks, dead clicks, navigation loops, and form abandonment rates at each step.
Nielsen Norman Group's research on user frustration shows that rage clicks are one of the strongest predictors of task abandonment. If you can reduce rage click density at a specific funnel step, you will almost certainly improve conversion through that step.
Technique 3: Segment-Specific Funnels
Your funnel performs differently for different user segments. Build separate funnel analyses for:
- New users vs. returning users
- Mobile vs. desktop
- Self-serve vs. sales-assisted
- Different acquisition channels
- Different user roles (admin vs. member)
McKinsey's research on personalization shows that segment-specific optimization produces 3-5x better results than optimizing for the aggregate.
Technique 4: Time-Based Analysis
Some funnel steps have time sensitivity. A user who completes the entire trial flow in one sitting behaves differently from one who spreads it across three days.
Analyze funnel performance by session frequency:
- Single-session completions
- Multi-session completions (2-3 sessions)
- Extended evaluation (4+ sessions over days or weeks)
Each pattern suggests different optimization strategies. Single-session completers need a frictionless fast track. Multi-session users need clear progress saving and re-engagement triggers. Extended evaluators might need additional social proof or a human touchpoint.
Technique 5: Exit Intent Analysis
When users drop off, journey data can tell you exactly where they went. Did they:
- Leave the product entirely? (You may need better value communication)
- Navigate to a competitor's site? (You may need stronger differentiation)
- Go to your pricing page? (They may have sticker shock or need a lower entry point)
- Visit your help center? (They are confused and need better in-product guidance)
Exit destination data turns a vague "they left" into a specific, actionable signal.
Funnel optimization is still essential. Funnels still provide a useful high-level framework for understanding conversion. The shift is in how you diagnose and fix problems within the funnel.
Journey intelligence gives you the diagnostic depth that funnels alone cannot provide. It turns "40% drop off at Step 3" into "15% leave because of pricing confusion, 12% need help docs, 8% have a technical blocker, and 5% are comparison shopping." Each of those segments needs a different fix.
If you are doing funnel optimization today, adding journey-level analysis will make every optimization more precise and more effective.
Adora's automated journey maps show you exactly what happens between each funnel step, with AI-powered signals that flag friction points automatically.
Start with your highest-volume funnel, add journey data, and let the actual user behavior guide your optimizations.
Related posts

Why We Built AI Product Insights
The story behind Adora's AI Insights, and why I think this is the future of how product teams operate.

Data-driven off a cliff: why dashboards are dead
Dashboards are dead. Not because data doesn't matter. But because the way we've been accessing it was never actually built for the people making product decisions. Here's what went wrong, and what comes next.

SaaS Pricing Pages to Sign Up Journeys
This teardown analyzes SaaS pricing pages and their connected sign up journeys. Learn how leading SaaS companies design pricing, CTAs, and sign up flows that reduce friction and increase conversion.