Growth metrics framework: visual analytics for scaling teams
Growth metrics framework: visual analytics for scaling teams
Growth metrics framework: visual analytics for scaling teams
You've got a product that works. Users love it. Adoption is climbing. Then you hire your second product person, and suddenly everything gets harder.
Conversations that used to happen at lunch now need to be backed by data. The decisions that felt obvious when you were three people now require alignment from five teams. Your metrics spreadsheet goes from cute to chaotic.
This is when you need a growth metrics framework. Not because you're obsessed with dashboards, but because you need everyone looking at the same things. You need your team to move fast without stepping on each other.
A strong framework does three things. It tells you what matters. It shows you where to look. And it gives you permission to ignore everything else.
What is a growth metrics framework?
A growth metrics framework is your operating system for growth. It's the set of metrics you choose, how they connect to each other, and how you visualize them so your team can act on them.
It's not just a list. It's a hierarchy.
Think of it like a map. You've got your North Star at the top, the one number that captures whether you're winning. Below that, you've got the levers you can pull. To the side, you've got guardrails that keep you from breaking things while you grow.
According to Amplitude, a North Star Metric is the single, measurable product metric that best captures the core value your product delivers to customers and is directly tied to long-term sustainable growth. For Netflix, that's total hours watched. For Slack, it's daily active users.
Your framework is worthless if it doesn't align your team. That alignment is the whole point.
Why you need a framework before you scale
When you're small, metrics happen naturally. You feel the business. You know which features work because you watch people use them. You know retention because you talk to customers.
The moment you cross fifteen or twenty people, that breaks. You can't hold all the context in your head anymore. You need structure.
Without structure, here's what happens. Your product team optimizes for feature velocity. Your sales team optimizes for revenue. Your support team optimizes for resolution time. Everyone's working hard. Everyone's pulling in different directions.
According to research, the metrics your team chooses to track should collectively create a North Star for your product and help you move toward the broad strategic goal you've set. When they don't, team members optimize locally and miss globally.
A framework fixes this. It says: "Here's what winning looks like. Here's what we measure. Here's how those things connect. Here's what we ignore."
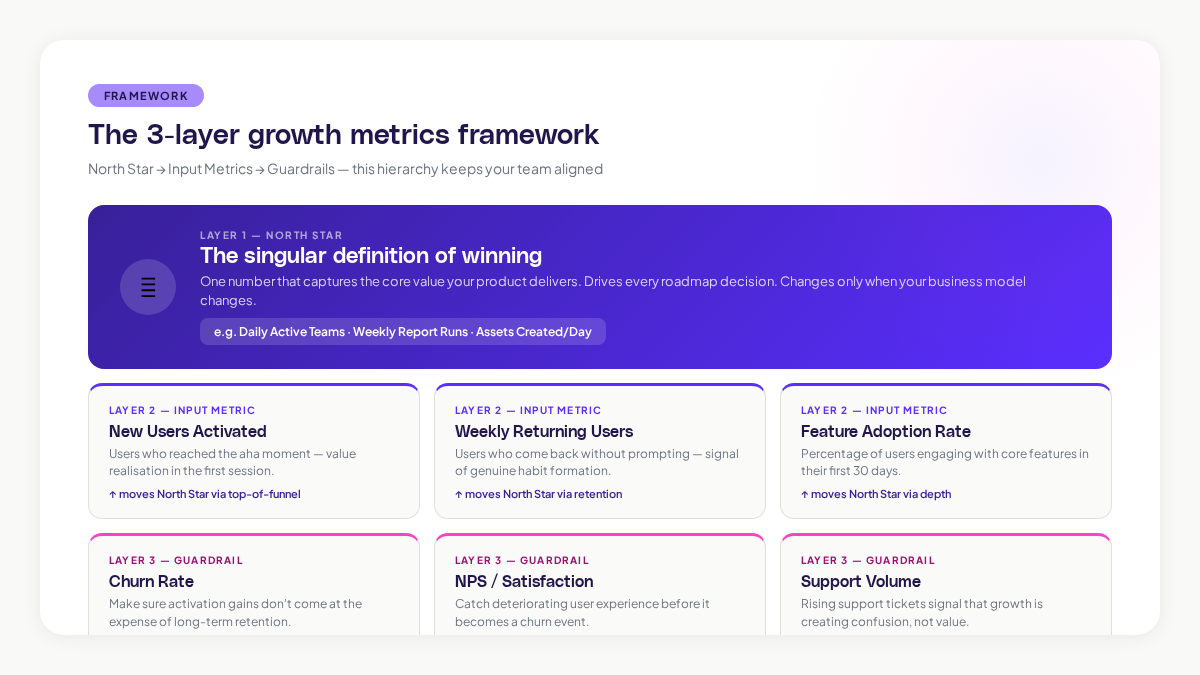
The three layers of your growth metrics framework
A solid growth metrics framework has three parts working together.
The North Star sits at the top. This is your singular definition of success. For a B2B SaaS company, it might be "Monthly Active Users." For an ecommerce platform, it might be "Gross Merchandise Value."
Your North Star should reflect the core value you deliver. If you pick something that doesn't connect to real customer value, your team will optimize for the metric and miss the business.
Input metrics are the levers. These are the things you actually move. They're the daily and weekly actions that compound into your North Star. If your North Star is Monthly Active Users, your input metrics might be "New Users Activated," "Weekly Returning Users," and "Feature Adoption Rate."
According to research on product-led growth metrics, input metrics are specific to your product, business, and industry. One team's activation metric is another team's noise.
Guardrails keep you honest. These are the metrics you watch to make sure you're not breaking the business while you grow. If you're pursuing activation, a guardrail might be "Churn Rate." You want activation to go up, but not at the cost of keeping users around.
Building your framework: the map of your growth model
Now you're ready to build. This isn't theoretical. Here's how you actually do it.
Step 1: Start with customer behavior. Before you pick metrics, watch what your users do. What's the action they take when they get value? Is it completing onboarding? Inviting a team member? Running a report?
This is your aha moment. The instant a user realizes your product solves their problem. Your framework should measure whether you're getting people to that moment faster.
Step 2: Define your North Star. Write one sentence. Not "maximize engagement," that's not a metric. Try "Daily Active Teams" or "Weekly Report Runs" or "Assets Created Per Day."
According to ProductLed, over 80 product companies have published their North Star Metrics as examples. Spend an hour reading through them. You'll see patterns emerge based on your business model.
Step 3: Map the levers. What one to three things directly move your North Star? This is where most frameworks get too complex. Resist the urge to add every metric you track. Research shows a single dashboard should have four to six primary metrics visible without scrolling.
Step 4: Add guardrails. Write down the numbers you never want to see drop: Churn Rate, NPS, Support volume. Guardrails are your safety net. They catch you before you break.
Choosing metrics that don't lie
One trap is seductive. It's the vanity metric trap.
Vanity metrics look like wins. Sign-ups up 40%. Page views up 60%. They feel great in a meeting.
But here's the problem: According to Castor Doc, vanity metrics are data points that appear significant but fail to provide valuable insight into actual product health. They're not directly correlated with your objectives.
So how do you spot a real metric? A real metric connects to something your customer cares about. It connects to revenue, directly or indirectly. And you can actually move it with product decisions.
"Sign-ups" is a vanity metric if half those users never come back. "Activated Users" is real, it means they got value.
Ask yourself: if this metric goes up but my revenue stays flat, have I won? If the answer is no, it's probably vanity.
Visualizing metrics for action
You can have the perfect framework and still fail if nobody can see it.
A metric in a spreadsheet that takes thirty minutes to understand isn't a metric. It's a distraction. Your team will ignore it.
A metric on a dashboard that communicates in five seconds? That's a metric that changes behavior.
According to Content Square, effective product dashboards focus on key metrics that align with your strategy, making it easier to spot trends and areas for improvement. Your dashboard should communicate the most important insights within five seconds.
Here's the rule: no more than one number per question your team asks.
Use color for signal. Green when you're on track. Yellow when you're slipping. Red when you need to act. Make it impossible to miss.
When to dig deeper with cohort analysis
Your North Star tells you if you're winning. Cohorts tell you where you're winning and where you're not.
A cohort is a group of users who share something in common. Usually their acquisition date. You compare how different cohorts behave over time.
Why does this matter? Because your North Star can hide problems.
You could be growing overall, but users acquired three months ago could be churning quietly. You wouldn't see that in your aggregate numbers.
According to OpenVC, cohort analysis gives you the ability to measure the impact of major feature releases and whether cohorts acquired after you launched a key integration show better long-term retention and higher lifetime value.
A retention curve shows how many users stay with you over time. Plot this by cohort and you'll see if your product is getting stickier.
Connecting metrics to real decisions
Here's where most frameworks die: they're built, they're pretty, and then nobody uses them.
The only metrics that matter are the ones that actually change how you work.
Your framework should drive decisions every single week. Here's what that looks like. Your North Star is Weekly Activated Users. It's been flat for three weeks. You pull up your input metrics. Activation is flat, but retention is actually good. So the problem isn't that new users stop coming back, the problem is you're not getting enough new users in the door.
That decision, focus on acquisition not retention, would never happen without the framework.
According to IBM, data-driven businesses are 58% more likely to beat revenue goals. The difference between those companies and everyone else isn't better data. It's that they actually use their data to make decisions.
Tools and infrastructure for your framework
You don't need fancy tools to start. You need the right signals.
Adora's Signals feature helps you spot the metrics that matter by automatically surfacing anomalies in your data. Instead of staring at a dashboard wondering what to focus on, Signals tells you what moved and by how much. That speeds up decision-making when you're scaling.
For visualization, you can start with spreadsheets and charts. As you grow, you'll want a dedicated tool that updates in real time. The tool matters less than the discipline of keeping one single source of truth.
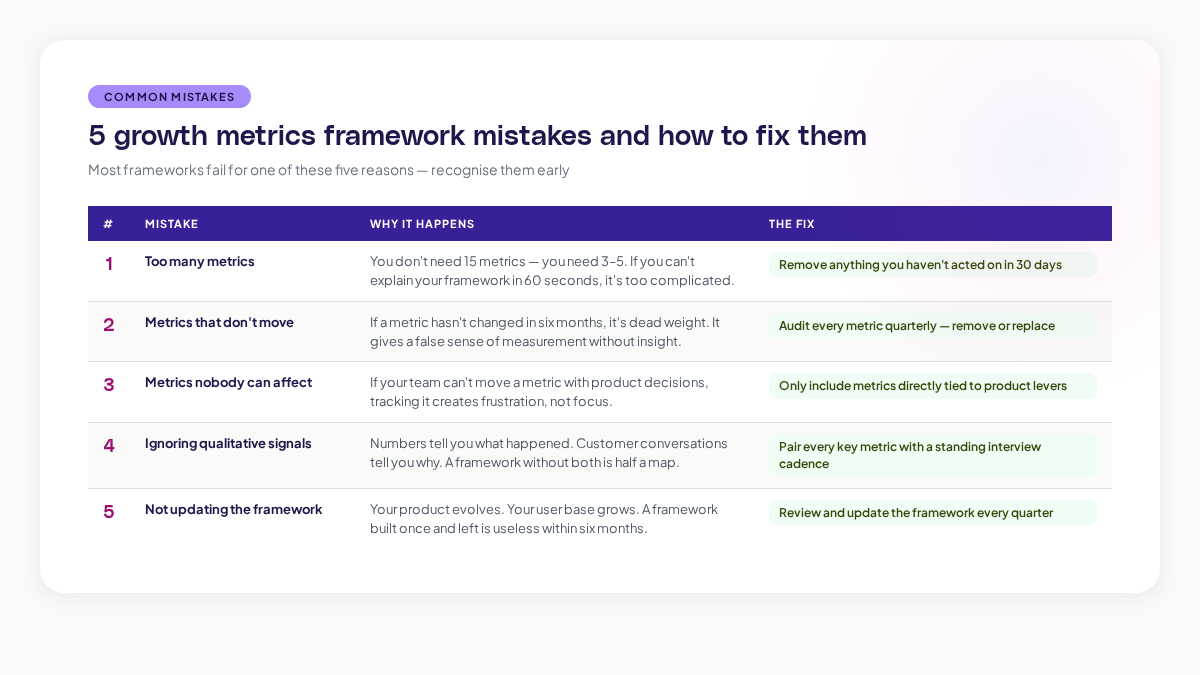
Common mistakes when building your framework
Mistake 1: Too many metrics. You don't need fifteen metrics. You need three to five. Everything else is detail. If you can't explain your framework in sixty seconds, it's too complicated.
Mistake 2: Metrics that don't move. If a metric hasn't changed in six months, it's dead weight. Remove it.
Mistake 3: Metrics nobody can move. If your team can't actually affect a metric, it'll just frustrate them. Pick metrics you can move with product decisions.
Mistake 4: Ignoring qualitative signals. Numbers tell you what happened. Conversations tell you why. Your framework should inform the questions you ask in customer calls, not replace them.
Mistake 5: Not updating it. Build your framework once and leave it, and it'll be useless in six months. Review your framework quarterly.
Your framework is an operating system
Think of your growth metrics framework as your operating system. It's not decoration. It's how your team operates.
When everyone's looking at the same metrics, you eliminate a thousand small conflicts. You remove the need to argue about whether something's working. You just look at the data.
Start small. Pick your North Star. Pick two or three input metrics. Pick one guardrail. Get them on a dashboard. Live with them for a month. Then adjust.
You'll know it's working when a team member pushes back on a decision because of what the metrics show. That's the moment your framework becomes your operating system.
Related posts

Why We Built AI Product Insights
The story behind Adora's AI Insights, and why I think this is the future of how product teams operate.

Data-driven off a cliff: why dashboards are dead
Dashboards are dead. Not because data doesn't matter. But because the way we've been accessing it was never actually built for the people making product decisions. Here's what went wrong, and what comes next.

SaaS Pricing Pages to Sign Up Journeys
This teardown analyzes SaaS pricing pages and their connected sign up journeys. Learn how leading SaaS companies design pricing, CTAs, and sign up flows that reduce friction and increase conversion.