North Star Metric Framework with AI Journey Data
North Star Metric Framework with AI Journey Data
Every product team gets told to find their north star metric. The single number that captures the value your product delivers to users. It sounds simple. In practice, it is one of the hardest decisions a product leader makes.
The problem is not finding a metric. It is finding the right metric. A north star metric that does not reflect actual user value leads your entire team in the wrong direction. And most teams choose their north star based on intuition and internal debate, not data about how users actually experience the product.
AI journey data changes the equation. When you can see every path users take through your product, you can validate whether your north star metric genuinely correlates with user success, or whether it is a vanity metric dressed up as strategy.
What makes a good north star metric
A strong north star metric has four properties. All four must be present. If your metric is missing even one, it will mislead your team.
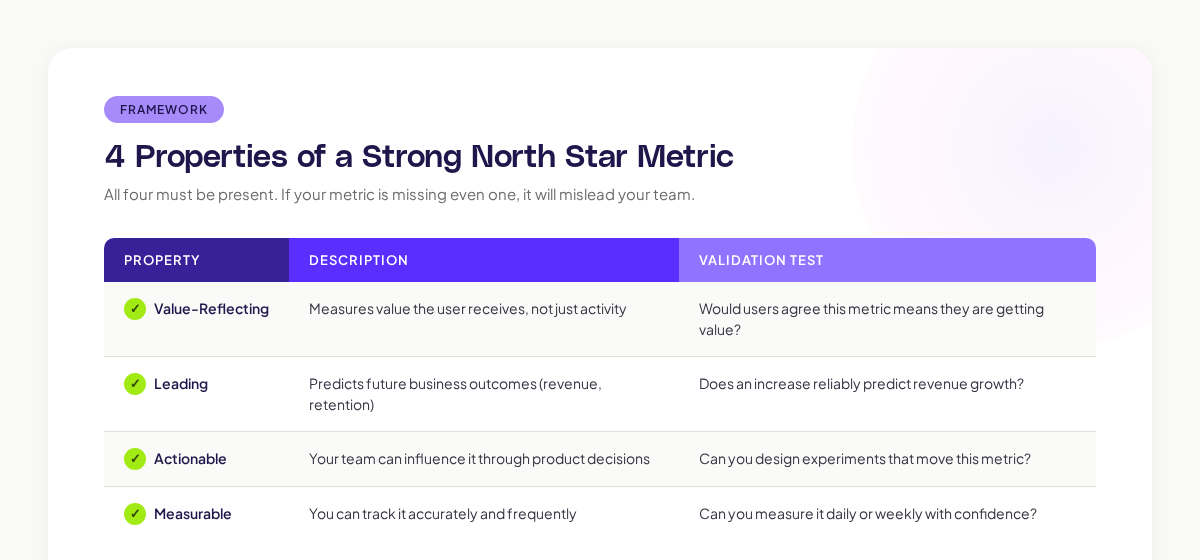
Here are examples across different product types:
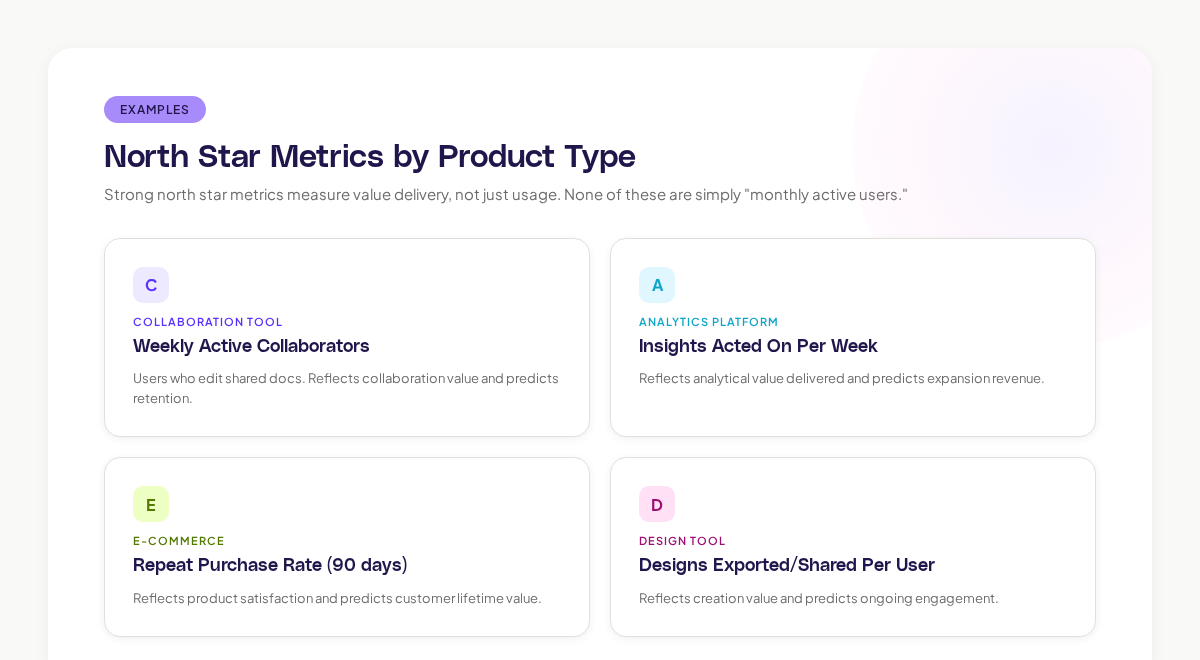
Notice that none of these are simply "monthly active users" or "total signups." Those are activity metrics, not value metrics. Sean Ellis's product-market fit framework emphasizes that the best growth metrics measure value delivery, not just usage.
Why most north star metrics are wrong
Based on what I have seen building products at Canva and now at Adora, the most common failure modes are:
1. Measuring Activity Instead of Value
"Daily active users" is not a north star. It tells you how many people opened your app. It says nothing about whether those people got value from it. A user who logs in, checks notifications, and leaves is "active." They are not necessarily getting value.
The fix: dig deeper into what "active" means. For a project management tool, "active" might mean "updated a task status." For a design tool, it might mean "exported a design." The specific action that constitutes value is your north star candidate.
2. Choosing a Metric That Cannot Be Influenced
Some metrics feel strategic ("Net Promoter Score") and are genuinely important to the business. The problem is that NPS is a lagging indicator influenced by hundreds of factors, many outside your product team's control (pricing, support quality, sales interactions). You cannot run a two-week experiment and meaningfully move NPS.
Forrester's research on experience metrics found that the most effective product teams use leading behavioral indicators (what users do) as their primary guidance, with lagging satisfaction indicators (what users say) as validation.
3. Picking a Metric Without Validating It Against Journey Data
Here is where journey data becomes essential. Your north star metric should correlate with the user journeys that drive your most important outcomes. If it does not, you are tracking the wrong thing.
Using journey data to find your north star
Step 1: Map Your Outcome Journeys
Start by identifying the journeys that lead to your three most important business outcomes:
- Retention: What do users who stay for 90+ days do differently from those who churn?
- Expansion: What do users who upgrade or invite teammates do differently?
- Advocacy: What do users who refer others or leave positive reviews do differently?
AI journey mapping makes this analysis practical by showing you the actual paths for each outcome group. You can filter journeys by "retained users" versus "churned users" and compare the patterns.
Step 2: Identify the Behavioral Divergence Point
Somewhere in the user journey, retained users and churned users diverge. They do something different. That divergence point is the strongest candidate for your north star metric.
For Slack, the divergence point was 2,000 messages sent by a team. Below that threshold, teams churned. Above it, they retained. That insight came from analyzing behavioral data, not from a strategy workshop.
A concrete example from my experience: at Canva, we found that users who shared a design with someone else within their first week had 3x the retention rate of users who only downloaded designs. The act of sharing was the behavioral divergence point. It became a key input to our growth strategy.
Step 3: Validate With Journey Correlation
Once you have a candidate metric, validate it against journey data:
- Segment users by the candidate metric. Users who hit the threshold vs. users who did not.
- Compare their journeys. Do high-metric users take different paths? Visit different screens? Encounter different friction?
- Check the business correlation. Do high-metric users retain longer, pay more, and expand more?
- Test for causation. Can you run experiments that increase the metric and observe downstream improvements in retention/revenue?
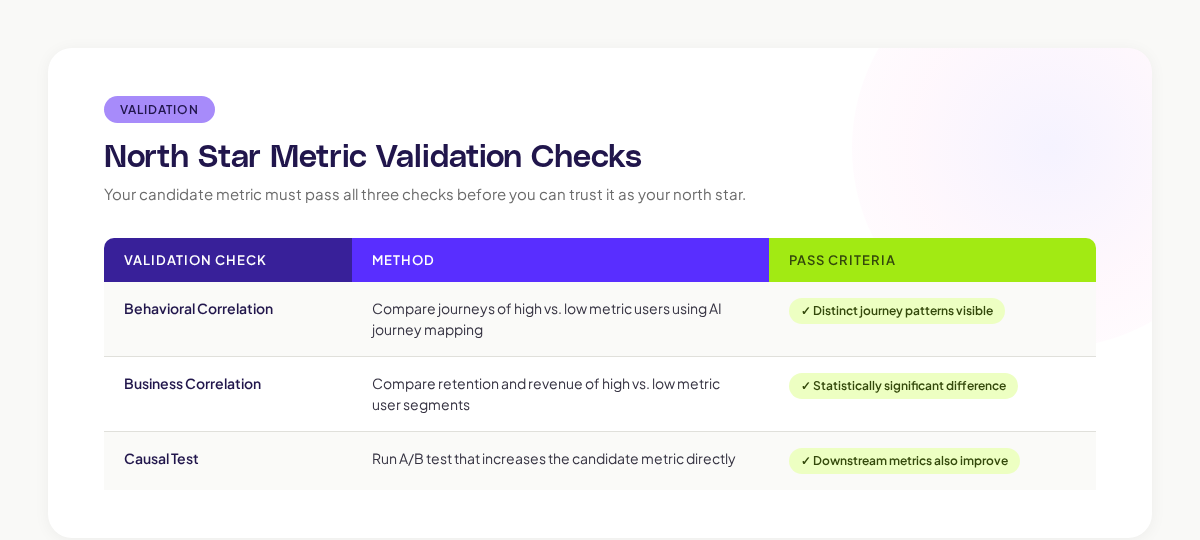
If your candidate passes all three checks, you have a validated north star. If it passes the first two but fails the causal test, it may be correlated with success without causing it. That still has diagnostic value. It just is not a reliable optimization target.
Building the north star framework around journey data
Once you have your validated north star metric, build a framework that connects it to daily work:
Input Metrics
Identify 3-5 input metrics that feed into your north star. These are the levers your team can pull.
For example, if your north star is "weekly active collaborators," your input metrics might be:
- New users who complete onboarding (feeds the pipeline of potential collaborators)
- Users who create a shared workspace (prerequisite for collaboration)
- First collaboration event within 7 days (activation moment)
- Returning collaborators week-over-week (retention signal)
Journey Health Indicators
For each input metric, identify the journey that drives it and track the journey's health:
- Is the onboarding completion rate stable? (Feeds new user pipeline)
- Is the shared workspace creation path clear and frictionless? (Feeds collaboration setup)
- How quickly do users discover collaboration features? (Feeds activation)
This is where Adora's journey intelligence becomes particularly valuable. It lets you see not just whether your input metrics are moving, but why they are moving by showing you the journey-level behavior behind each metric.
Review Cadence
- Daily: Check north star metric trend
- Weekly: Review input metrics and journey health indicators
- Monthly: Deep dive into journey patterns, validate that north star still correlates with business outcomes
- Quarterly: Reassess whether the north star metric itself needs updating (as your product evolves, the right north star may shift)
Common north star metric anti-patterns
The vanity north star. A metric that goes up and to the right and makes everyone feel good, but does not predict business outcomes. Total registered users is the classic example. It only goes up (unless you delete accounts), and it says nothing about value or health.
The lagging north star. A metric that tells you what happened months ago (annual revenue, NPS). By the time it moves, it is too late to diagnose why. Use leading behavioral metrics that give you signal in days or weeks.
The team-centric north star. A metric chosen because one team can influence it, not because it reflects user value. Engineering might want "API response time." Design might want "task completion rate." These are team health metrics, not north star candidates. The north star should reflect the value the user receives.
The fixed north star. A metric that was right when your product was young and has not been re-evaluated since. Gartner's research on product management practices recommends quarterly north star validation, because user behavior and product surface area change constantly.
Key takeaways
Your north star metric is only as good as the data behind it. Choosing a north star based on internal debate without validating it against actual user journey data is like setting a company strategy based on a hypothesis you never tested.
AI journey data gives you the validation layer that makes your north star reliable. Map the journeys of your most successful users, find the behavioral divergence point that separates them from churned users, and validate that the divergence point is causal, not just correlated.
Then build your framework: input metrics that feed the north star, journey health indicators that explain why inputs are moving, and a review cadence that keeps everything current.
Start by asking one question: "What do our best users do differently?" The answer is in the journey data.
Related posts

Why We Built AI Product Insights
The story behind Adora's AI Insights, and why I think this is the future of how product teams operate.

Data-driven off a cliff: why dashboards are dead
Dashboards are dead. Not because data doesn't matter. But because the way we've been accessing it was never actually built for the people making product decisions. Here's what went wrong, and what comes next.

SaaS Pricing Pages to Sign Up Journeys
This teardown analyzes SaaS pricing pages and their connected sign up journeys. Learn how leading SaaS companies design pricing, CTAs, and sign up flows that reduce friction and increase conversion.