User Retention Strategies Built on Journey Analytics
User Retention Strategies Built on Journey Analytics
Retention is where SaaS companies are built or broken. You can have the best acquisition engine in the world, and it will not matter if users leave after the first month. A 5% improvement in retention has a larger impact on lifetime value than a 25% improvement in acquisition.
Most retention strategies focus on what happens after users show signs of leaving: win-back emails, discount offers, "we miss you" campaigns. By that point, you are playing catch-up. The most effective user retention strategy starts much earlier, at the journey level.
Journey analytics reveals the behavioral patterns that predict retention and churn weeks before traditional metrics detect a problem. When you can see how a user's journey pattern is changing, you can intervene before they make the decision to leave.
Why traditional retention metrics are lagging
The standard retention metrics (monthly retention rate, churn rate, DAU/MAU ratio) tell you what already happened. A user who churned last month made that decision days or weeks before their subscription expired. By the time churn shows up in your dashboard, the opportunity to prevent it has passed.
Research from Bain & Company found that a 5% increase in customer retention increases profits by 25-95%. The economics are clear. The question is how to detect and prevent churn proactively.
Journey analytics provides leading indicators because it measures how users behave, not just whether they are "active." A user who logs in daily but has stopped using core features, shortened their sessions, and exhibits more friction signals is behaviorally disengaging, even though traditional metrics show them as "retained."
The journey-based retention framework
Stage 1: Define Your Retention Journeys
Retention is not one journey. It is a collection of recurring journeys that keep users engaged. Identify yours:
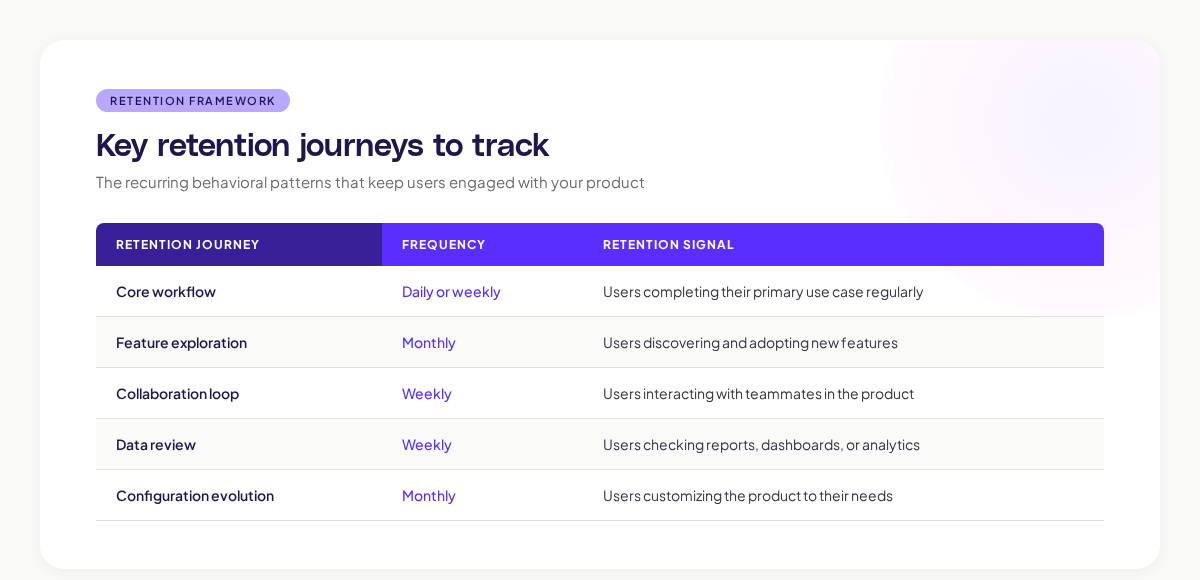
Each retention journey should happen at a predictable cadence. When the cadence breaks (a daily user becomes a weekly user, a weekly reporter stops checking reports), that is an early warning signal.
Stage 2: Build Behavioral Health Scores
Create a composite score that reflects the health of a user's engagement across their retention journeys:
Healthy signals:
- Session frequency at or above their historical baseline
- Feature breadth stable or increasing
- Core workflow completion consistent
- Low friction signal density
Declining signals:
- Session frequency declining for 2+ consecutive weeks
- Feature breadth narrowing (using fewer features)
- Core workflow incompletions increasing
- Higher friction signal density
At-risk signals:
- Session frequency below 50% of historical baseline
- Only visiting one or two screens per session
- No feature exploration in 30+ days
- Repeated encounters with the same friction point
Forrester's research on customer health scoring recommends using behavioral indicators over satisfaction surveys for early churn detection because behavior changes faster than sentiment and is more objectively measurable.
Stage 3: Map Churn Journeys
What do the last 30 days look like for users who churned? Journey analytics can answer this by retrospectively analyzing the journey patterns of churned users:
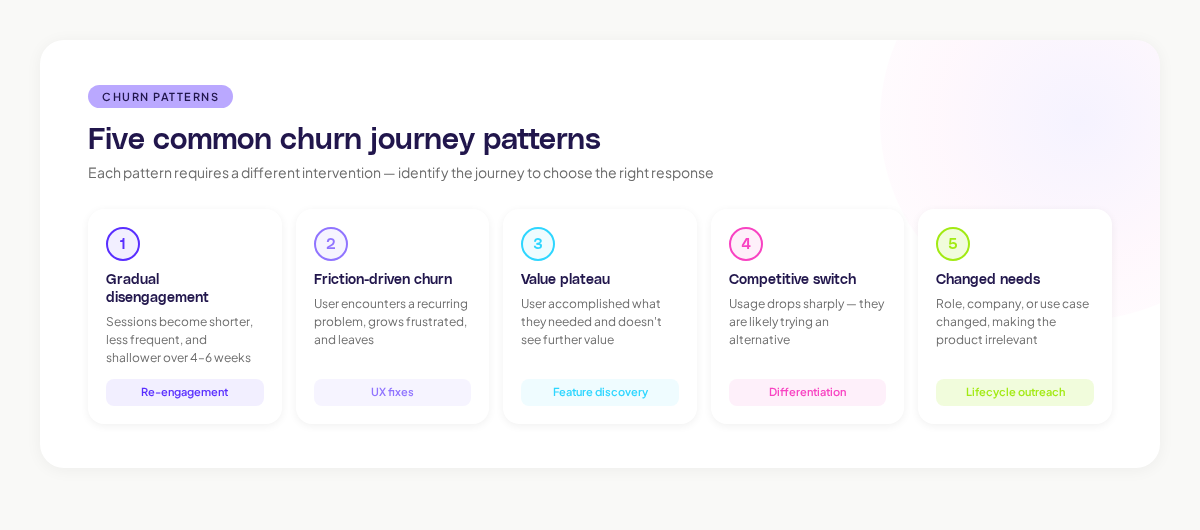
Each pattern requires a different intervention. Gradual disengagement needs re-engagement and value reinforcement. Friction-driven churn needs UX fixes. Value plateau needs feature discovery prompts. Competitive switches need differentiation and switching cost reinforcement.
When I worked at Canva, we analyzed the journey patterns of churned users and found that a significant segment had encountered a specific workflow limitation (inability to collaborate on brand assets or in-abilty to quickly complete a goal). Their journeys showed repeated attempts to share brand elements, followed by workarounds using external tools, followed by declining engagement. Understanding the specific journey unlocked a product solution that addressed the root cause.
Proactive retention interventions
For Declining Users
Users whose behavioral health score is declining need gentle re-engagement:
- Surface features they have not tried that are relevant to their use case
- Send contextual product tips based on their specific journey patterns (not generic emails)
- Offer guided workflows that deepen their engagement with features adjacent to their core usage
For At-Risk Users
Users showing at-risk signals need more direct intervention:
- Trigger in-product prompts offering help or guidance
- For high-value accounts, alert customer success for personal outreach
- Offer a quick-win experience: a template, a preconfigured report, or a walkthrough that delivers immediate value
For Friction-Stuck Users
Users who repeatedly encounter the same friction point need that friction removed:
- Fix the underlying UX problem (the best retention intervention is a better product)
- If the fix requires time, provide a workaround or alternative path
- Acknowledge the friction transparently and communicate your timeline for fixing it
Research from the American Express Customer Service Barometer found that 33% of customers consider switching after a single instance of poor service. In product terms, a single frustrating experience can trigger the churn decision. Journey analytics helps you catch these friction points before they accumulate.
Measuring retention at the journey level
Journey Retention Rate
For each retention journey, measure the percentage of users who continue performing that journey on their expected cadence:
- What percentage of daily core workflow users are still performing it daily after 30 days?
- What percentage of weekly report viewers are still viewing reports weekly after 90 days?
Journey-level retention is more granular and more actionable than aggregate retention rate.
Journey Depth Over Time
Track whether users are engaging more deeply or more shallowly over time:
- Are they visiting more screens per session or fewer?
- Are they using more features or retreating to a small set?
- Is their path efficiency improving (getting better at using the product) or declining (getting confused)?
Adora's behavioral signals track these patterns automatically, giving you a real-time view of how deeply each user engages with your product over time.
Cohort-Level Journey Health
Segment users by signup cohort and track journey health metrics over time. Are newer cohorts retaining better or worse? Is a specific cohort exhibiting unusual journey patterns?
This helps you separate product effects (a change you made improved retention for everyone) from cohort effects (a shift in acquisition source changed the type of users signing up).
Building habit loops
The strongest retention mechanism is habit. When your product becomes part of a user's regular workflow, retention happens automatically. Journey data helps you identify and strengthen habit loops.
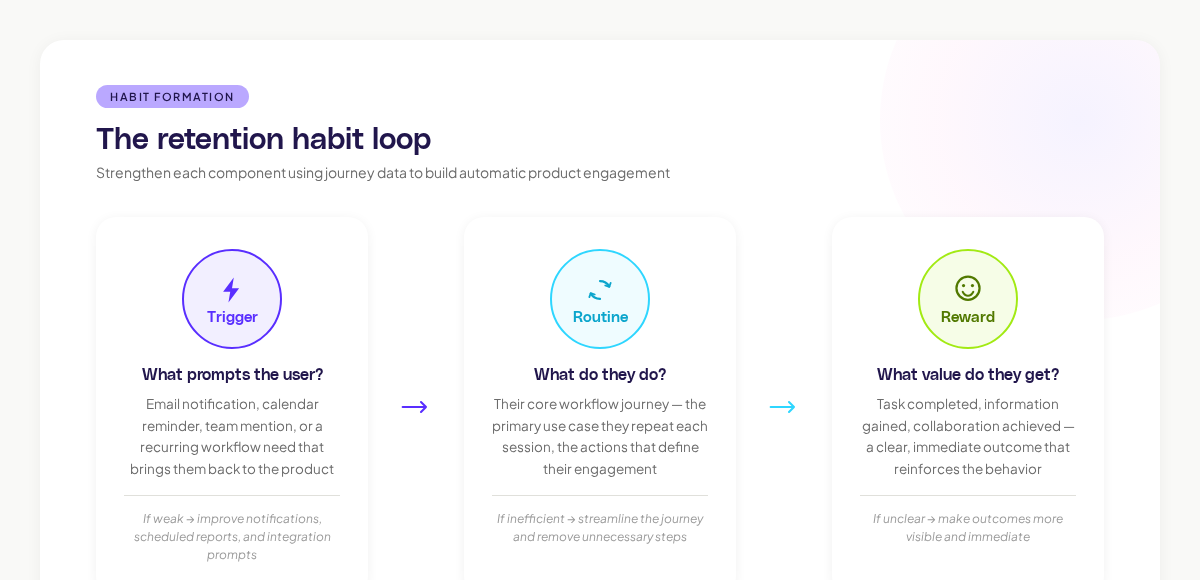
A habit loop has three components (as described by Charles Duhigg's research):
- Trigger: What prompts the user to open your product? (Email notification, calendar reminder, team mention, workflow need)
- Routine: What does the user do when they arrive? (Their core workflow journey)
- Reward: What value does the user get? (Task completed, information gained, collaboration achieved)
Journey data reveals how strong your habit loops are:
- Are triggers working? (Do notification-prompted sessions show different journey patterns than organic sessions?)
- Is the routine efficient? (Is the core workflow journey smooth and fast?)
- Is the reward clear? (Do users who complete the core workflow return more frequently?)
Strengthen weak components:
- Weak triggers: Add or improve notification systems, scheduled reports, or integration prompts
- Inefficient routines: Streamline the core workflow journey, remove unnecessary steps
- Unclear rewards: Make the outcome of using your product more visible and immediate
Key takeaways
User retention strategy works best when it is proactive, not reactive. Journey analytics provides the early warning signals that traditional metrics miss: declining session depth, narrowing feature usage, increasing friction encounters.
Build behavioral health scores from journey data. Map the common churn patterns. Design interventions for each pattern. Strengthen habit loops by improving triggers, streamlining routines, and clarifying rewards.
The teams with the best retention rates are the ones that understand what their retained users do differently from their churned users, and then engineer more users toward those retention-positive journeys.
Start by analyzing the last 30 days of journey data for users who recently churned. The patterns will tell you exactly where your retention strategy needs work.
Related posts

Why We Built AI Product Insights
The story behind Adora's AI Insights, and why I think this is the future of how product teams operate.

Data-driven off a cliff: why dashboards are dead
Dashboards are dead. Not because data doesn't matter. But because the way we've been accessing it was never actually built for the people making product decisions. Here's what went wrong, and what comes next.

SaaS Pricing Pages to Sign Up Journeys
This teardown analyzes SaaS pricing pages and their connected sign up journeys. Learn how leading SaaS companies design pricing, CTAs, and sign up flows that reduce friction and increase conversion.